Key Findings:
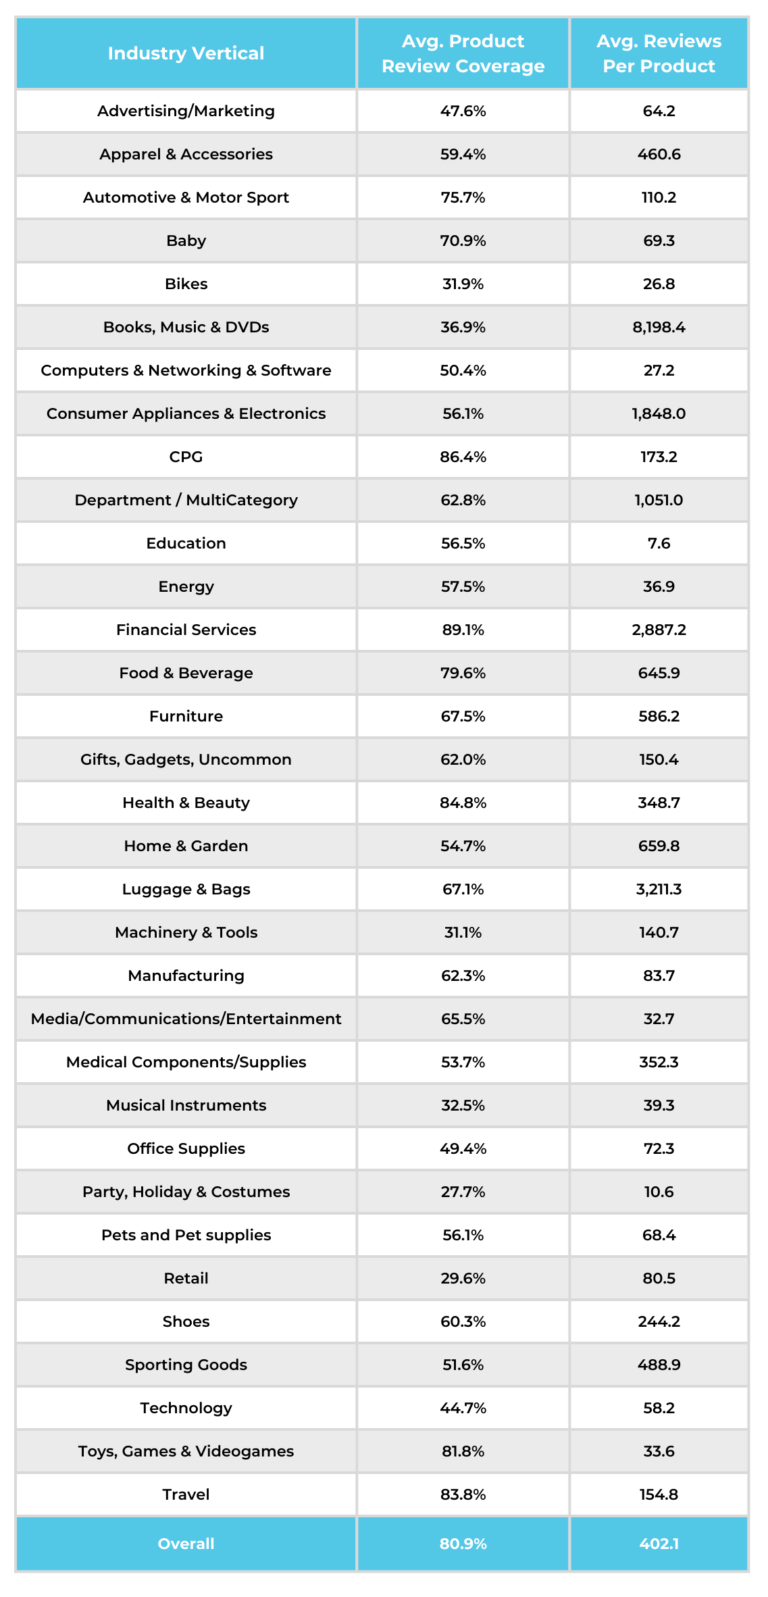
- Overall review coverage across verticals is 80.9%, with 402.1 reviews per product, on average.
- The verticals with the highest overall review coverage included Financial Services; CPG; and Health & Beauty.
- The verticals with the lowest overall review coverage included Party, Holiday & Costumes; Retail; and Machinery & Tools.

To benchmark review volume, we analyzed overall review coverage (how many products have at least 1 review) and review coverage per product (the average number of reviews per product). The average review coverage across verticals is 80.9%, with 402.1 reviews, on average, for each product.
The three verticals with the highest overall review coverage included Financial Services (89.1%), CPG (86.4%), and Health & Beauty (84.8%). Those with the lowest overall review coverage included Party, Holiday & Costumes (27.7%), Retail (29.6%), and Machinery & Tools (31.1%).
On a per-product basis, Books, Music & DVDs shined with 8,198.4 reviews per product, on average, followed by Luggage & Bags (3,211.3 reviews per product) and Financial Services (2,887.2 reviews per product). The verticals with the lowest review coverage per product included Education (7.6 reviews per product), Party, Holiday & Costumes (10.6 reviews per product), and Bikes (26.8 reviews per product).
Financial services stands out as a “top performer” but this does come with a caveat: specifically, the financial services use case for a reviews platform tends to be unique (here are some examples). While every deployment is different, typically these organizations tend to collect reviews on fewer products overall – which goes some way to explaining the results here.
While the idea of having 1,000+ reviews per product may sound astronomical, the winners here are not exceeding consumer expectations; rather, they are meeting them.
The Importance of Review Coverage: Consumers Expect High Review Volumes
Review coverage is one of the top factors shoppers consider when reading reviews, second only to star rating. 79% of consumers “always” or “regularly” consider review volume. In late 2021, we surveyed more than 9,000 consumers about their expectations for review coverage. One in four consumers told us that ideally, a product would have more than 500 reviews. In this Benchmark Report, fewer than one-quarter (23%) of the verticals meet this expectation.
Increasing review coverage is not just about meeting consumer expectations, it also drives tangible benefits for brands: review coverage has an exponential impact on purchasing behavior. 64% of consumers say that they are more likely to buy a product with 1,000 reviews than one that has only 100, assuming they have the same average star rating. This number is even higher among Gen Z shoppers (80%) and Millennials (74%).
When a product goes from 0 reviews to 1, the conversion rate increases by 52.2%. Collect 51 to 100 reviews, and the conversion rate is 148.7% higher. When you start collecting reviews in the thousands, the conversion rate keeps increasing — illustrating that when it comes to reviews, more is always better. For example, there’s a 296.2% lift in conversion among shoppers who are exposed to 5,000 or more reviews.
It is easy to understand why a product with 0 reviews has a lower conversion rate. If we change the baseline to 1 to 100 reviews, however, we still see an incredible conversion lift when products begin accumulating over 1,000 reviews. For example, products with 1,001 to 5,000 reviews convert at a rate 83.7% higher than those with 1 to 100 reviews. Reach 5,000 reviews, and the conversion rate increases by 122.1%!
Review coverage is especially important when customers are purchasing new products or brands, according to 71% of consumers.
Consumers consider review coverage to be particularly important for certain verticals, including Consumer Appliances & Electronics, Health & Beauty; Apparel & Accessories; Furniture; and Pet Supplies. However, no matter your vertical, the message is clear: more reviews are always better. The journey to 1,000 reviews starts with these five tips.
Five Snackable Data-Backed Review Volume Tips
- Follow up with every customer to leave a review: Our research shows that nearly 80% of all review content comes from an email request. Send an email to every verified purchaser asking them to review their purchase. Follow up after 7 days for seasonal products, 14 days for perishable and soft goods, and 21 days for hard goods.
- Prioritize: Review coverage is a big concern for pretty much every brand and retailer. Where possible, look to prioritize collection for products with few (or no) reviews.
- Get creative: While email is the most common review collection method, there are others. Asking for reviews via text message and on store receipts are two such examples. Are you maximizing your opportunities to ask for reviews?
- Incentivize: When La Colombe Coffee Roasters ran a review sweepstakes, the brand generated over 6,000 reviews across 90% of their products, leading to a 3X conversion lift. The campaign was so successful the brand now runs a quarterly sweepstakes. Similarly, 73% of consumers say they need an incentive to write a review, be it a purchase discount or loyalty points. Make writing a review a point-earning activity in your customer loyalty program. When customers are sent a free product sample, they are also more likely to write a review. This is why product sampling is such a commonly used technique.
- Syndicate your reviews to retail partners: By syndicating your reviews, you can drive review coverage across your brand’s website as well as those of your retail partners, such as Amazon, Target, and Walmart. This ensures that consumers are presented with a high volume of reviews to read, no matter where they prefer to buy your products.
More Benchmarks
UGC Benchmarks: Review Influence on Online Traffic to Product Pages
More Reviews and Stronger Average Ratings Increase Product Page Visits
Visual UGC Benchmarks: Av. Interactor and Impression Conversion Lift
Modest conversion lift for Visual UGC impressions; but Visual UGC Interactions more than double conversion
Q&A: Av. Interactor and Impression Conversion Lift
A Q&A Impression Lifts Conversion by 51%, While a Q&A Interaction Lift Conversion 138%
Ratings & Reviews: Av. Interactor and Impression Conversion Lift
Simply Seeing Reviews Lifts Conversion by 20%, While Interacting With Reviews Lifts Conversion by 128%
Ratings & Reviews Benchmarks: Visual UGC
Despite Increasing Importance to Consumers, Average Media Coverage for Most Brands Hovers Around 37%
Ratings & Reviews Benchmarks: Review Length
The Average Review Is Only 218 Characters Long, Far Below the Consumer-Preferred 500+ Minimum
Ratings & Reviews Benchmarks: Average Av. Rating
Across Verticals, Average eCommerce Product Rating is 4.5 Stars
Ratings & Reviews Benchmarks: Average Rating Impact on Conversion
The Sweet Spot for conversion is 4.75-4.99 stars


