Power Points:
- In 2022, there was a 3.8% lift in conversion among site visitors who were served up some form of UGC.
- Visitors who interact with UGC in some way convert at a rate that’s 102.4% higher than average. This is up slightly from a conversion lift of 100.6% in 2021.
- There was a 108.6% lift in conversion among shoppers who interact with ratings and reviews.
- Some of the review features that drive the largest conversion lifts include Helpful Yes votes (356.3%), Helpful No votes (271.9%) and Review Search (271.9%). You can find real-life examples of these features and others later on in this report.
- The most common way for shoppers to apply star rating filters is on one-star review content. 61.3% of star rating filter interactors do so.
- There’s a 71.9% lift in conversion among those who click to only see one-star reviews, which is proof positive that negative reviews don’t necessarily scare shoppers away.
- There was a staggering 177.2% lift in conversion among consumers who interacted with Q&A on the product page.
- Certain Q&A features have a particularly large impact on conversion rates, including Show More Answers (178.1%), Click Read Answers (178.1%), and Answer Helpful 165.6%. We’ll share real-world examples of each of these features (and others) in the Q&A portion of this report.
- In 2022, there was a 103.9% lift in conversion among visitors who interacted with user-generated photos and videos.
- Certain interactions are especially impactful on conversion rates, including clicking to expand the image gallery (103.1%), clicking to view the next image/video (106.3%), and clicking to see the previous image/video (93.8%).
- When looking to develop a winning UGC display, best practices are a good place to start. However, there’s no “one size fits all” UGC display. What works for one business may fall flat for another.
- The key is to analyze your UGC performance on a regular basis. Then, leverage those insights to fuel optimizations that increase conversion impact.
Introduction
Consumers Depend on User-Generated Content
Modern consumers weigh any number of considerations when making a purchase decision. But increasingly, they’re seeking out user-generated content to guide them during the purchase journey.
If you’re not convinced, consider the following facts:
But How Does UGC Actually Impact Visitor Conversion?
Meeting shoppers’ expectations is reason enough to make user-generated content a priority. After all, if you don’t give shoppers (even the so-called loyal ones) what they want, they won’t hesitate to look elsewhere. Salesforce research tells us 71% of consumers have switched brands at least once in the last year.
But before doubling down on UGC, brands and retailers want to understand the expected return. This is understandable. In the best of times, it’s important to allocate resources where you’ll see the biggest return. This is even more true in times of economic uncertainty.
Typically, conversion is the metric brands and retailers focus on most. So, what exactly is the conversion impact of user-generated content?
For this year’s edition of our annual conversion report, we analyzed activity on more than 1,200 brand and retailer sites during 2022 to understand how three key types of UGC impact conversion:
- Ratings and reviews
- Q&A
- Visual content
Beyond looking at the overall impact of each type of UGC, we also drilled down further to understand the impact of key features of each type of UGC.
Measure, Optimize, Repeat
Understanding how user-generated content (and the specific features of UGC) impact conversion is certainly important. But it’s not the end all be all.
There’s no one-size-fits all review display that’ll deliver maximum ROI for all brands and retailers. Each business is different. And it’s important to determine what works best for yours.
Use the insights in this report to identify new features and functionality that are worth exploring. Then, measure the performance of your UGC regularly. And use those insights to drive further optimizations that generate the highest impact on conversion rates.
Methodology and Definitions
The following report is based on an analysis of activity on 1.5MM online product pages from over 1,200 brand and retailer sites during 2022. Here is list of key terminology to refer to when reading the report:
How UGC Impacts Visitor Conversion
The Simple Act of Displaying UGC on Product Pages Positively Impacts Conversion
When looking at activity during the entire year of 2022, there was a 3.2% conversion rate on the 1,200 sites we analyzed running PowerReviews’ UGC technology. This figure may be a bit higher than other benchmarks from other sources. There are a couple reasons for this.
- We base conversion on visitors rather than sessions. Reference the section above for additional information on our methodology.
- Assuming the product detail page is built this way (which most are), all shoppers in the sample we analyzed are served up some form of UGC above the fold. In most cases, this is a UGC summary that includes the product’s average star rating, review count and review distribution. Again, see the methodology section above for more information on what we classify as a UGC impression or UGC interaction.
Once a site visitor scrolls to a point where they see some form of UGC, their likelihood of conversion increases. In fact, there’s a 3.8% lift in conversion when a site visitor is served some form of UGC.
UGC Interactions Drive Conversions
Though the presence of UGC impacts conversion, the real magic happens when visitors interact with this content. In 2022, there was a 102.4% lift in conversion among UGC interactors – which is up slightly from 100.6% in 2021.
Throughout this report, we’ll dig deeper into the different ways shoppers are interacting with UGC – and how these myriad interactions impact conversion.
The Impact of Ratings & Reviews on Purchase Behavior
Ratings and Reviews Continue Boost Conversion Rates 2X
At the start of the pandemic, consumers started shifting a greater portion of their spending online. Three years later, this trend continues – with no signs of slowing down. By 2026, Statista predicts that ecommerce will account for 24% of total retail sales worldwide.
There are many benefits to browsing and buying online. But one downside is that there’s risk involved with purchasing a product without first experiencing it in person.
Reading reviews from those who have already purchased the product in question helps shoppers overcome this risk. In addition, accessing this feedback increases shoppers’ likelihood of making a purchase. In 2022, there was a 108.6% lift in conversion among site visitors who interact with ratings and reviews – which is up slightly from 2021.
How Myriad Review Interactions Drive Conversion
Each ratings and reviews display includes a number of features and functionality that help shoppers find and consume the most relevant content. In the chart below, you’ll see a high level look at how key ratings and reviews features impact conversion. Then, we’ll take a closer look at each of these features.
Helpful Votes
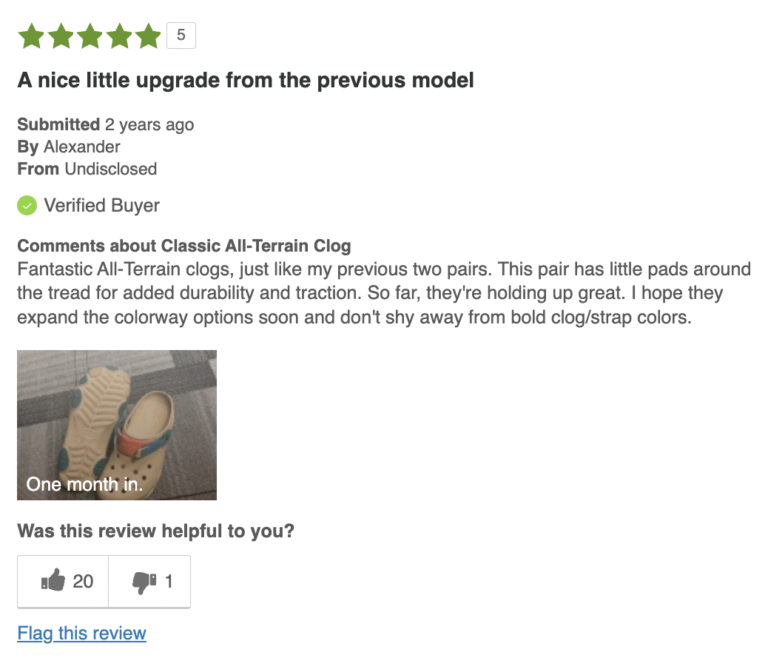
Let’s face it: some reviews are more helpful than others. The reviews that are most helpful are those that speak to the individual’s wants, needs, use cases, and concerns. On many review displays, a shopper can indicate whether a review is or isn’t helpful by clicking on a thumbs up or thumbs down icon.
Again this year, helpful voting is the type of review interaction with the largest impact on conversion. There’s a staggering 356.3% lift in conversion for visitors who click the thumbs up to indicate a review was helpful.
However, a less-than-helpful review doesn’t mean the sale is doomed. Quite the opposite. Site visitors who click the thumbs down icon convert at a rate that’s 271.9% higher than average.
Review Search
These days, consumers expect to find a high volume of reviews for any product they’re considering. A recent survey found that nearly a quarter (23%) of consumers say that ideally, products should have 500 reviews or more!
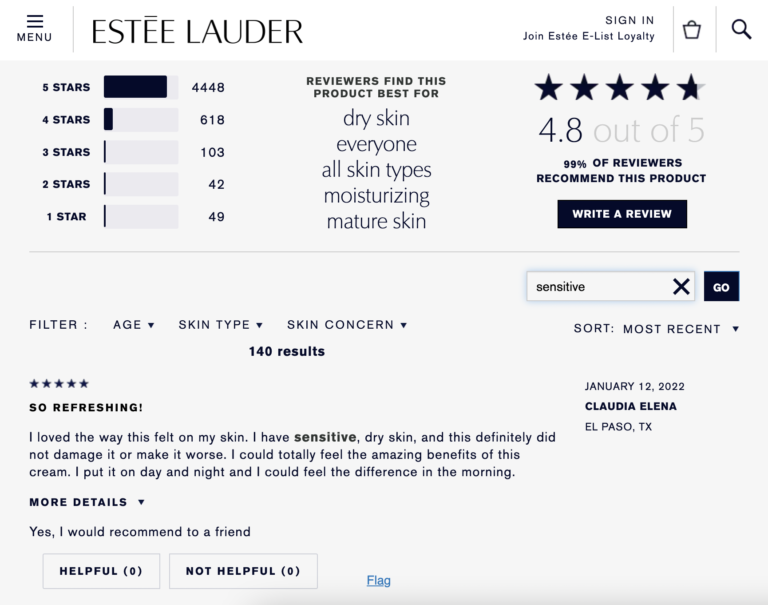
But that doesn’t mean shoppers are reading every review for a product. Instead, they’re honing in on the content that’s most relevant to them. One way they do this is by doing a search for a specific keyword or phrase.
Using the review search bar has a huge impact on conversion. Those who use it convert at a rate that’s 271.9% higher than average.
Footer Actions
By default, a certain number of reviews are displayed on a given product page. Once a visitor has scrolled to the bottom of the display, they typically have the option to navigate in a number of ways.
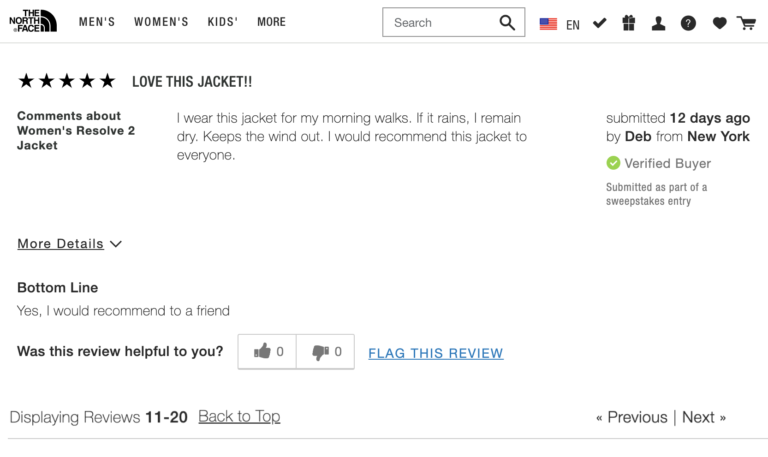
Here’s a look at three such actions – and how each impacts conversion rates. Interestingly, clicking “back to top” was the footer action with the largest impact on conversion in 2022. In both 2021 and 2020, hitting the “previous” link was the footer action with the largest impact.
Review Snippet
The vast majority of consumers actively seek out review content. As such, it’s a best practice to display a summary of review content at the top of the product page. This summary – also known as a snippet – usually includes information like the average star rating and review count for the product in question.
A great average star rating can entice shoppers to click the snippet. When they do, they’re taken to the full review display to sort, filter, search and read reviews.
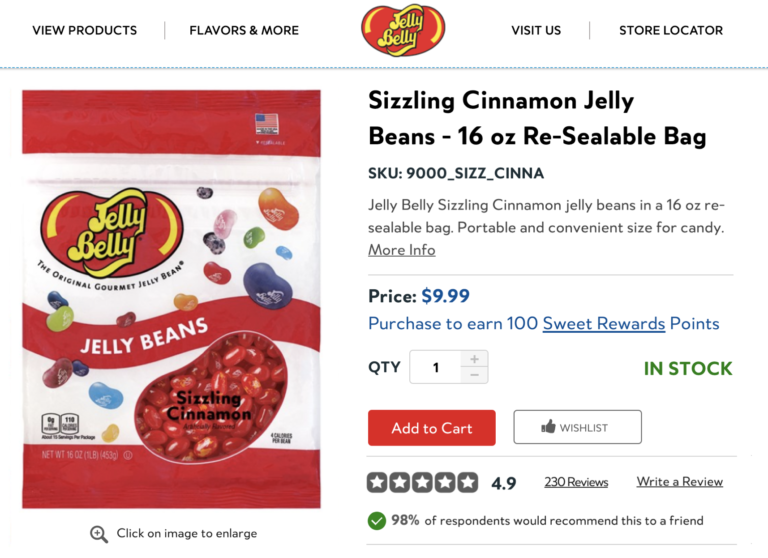
In 2022, there was a 153.1% conversion lift among site visitors who clicked the review snippet. If you don’t already, be sure to incorporate a review snippet “above the fold” on your product pages. This content is sure to capture shoppers’ attention, entice them to learn more, and ultimately, convince them to convert!
Review Faceoff
Some brands and retailers incorporate a review faceoff into their display. Essentially, a faceoff shows a product’s most liked positive review next to its most liked negative one. Faceoffs are a really helpful tool for shoppers. Faceoffs allow consumers to quickly and understand the best and worst experiences others have had with the product.

Perhaps not surprisingly, there’s a significant lift in conversion – to the tune of 131.3% – among shoppers who click to read the complete positive review featured in the review snapshot. Clearly, a glowing review can be the push a shopper needs to follow through with a purchase.
What is surprising is that there’s a 118.8% lift in conversion when visitors click to read the complete negative review. This is yet another data point proving that negative reviews – while never the goal – aren’t the enemy. Rather, this content helps shoppers understand the worst case scenario – and whether it’s something they can live with. (*Spoiler alert: it often is).
Review Sorting
As we’ve mentioned multiple times, consumers don’t read every review available for a product. Instead, they seek out content that speaks to their needs and use cases.
The best review displays include sorting functionality that allows shoppers to quickly surface the most relevant content. For example, shoppers may be able to sort content based on a number of factors, including recency, star rating, helpfulness, and inclusion of visual content.
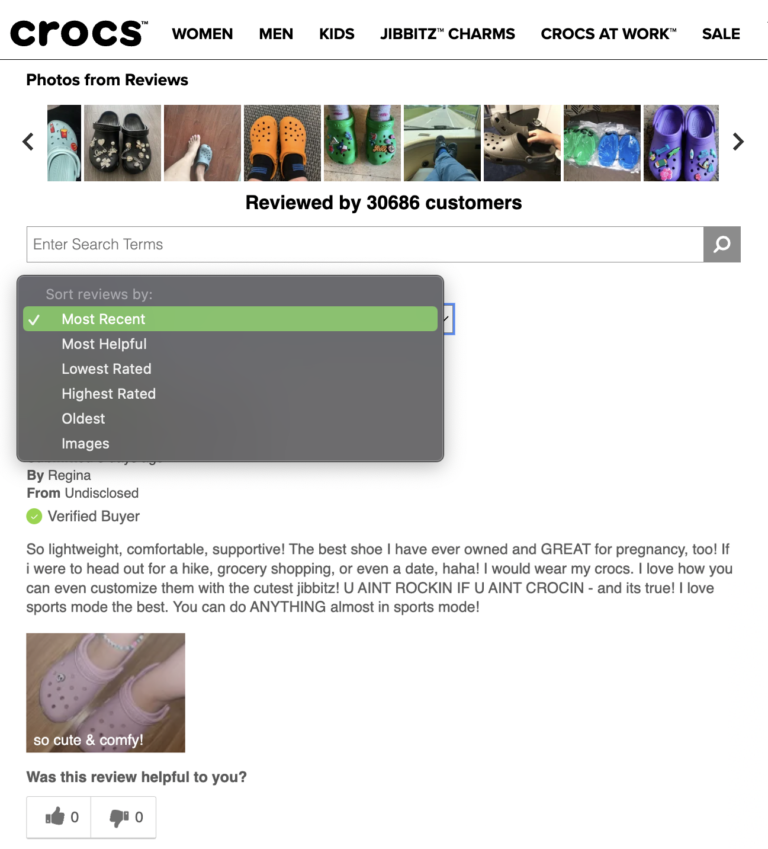
In 2022, there was a 103.1% lift in conversion among visitors who clicked to sort reviews in some manner.
Different types of sorting behavior have varying levels of impact on conversion. In 2022, the sorting behavior with the greatest impact was sorting by highest rating. This makes sense, as seeing positive reviews front and center can boost confidence and conversion.
In the chart below, we dig deeper into the conversion impact of the most common types of sorting behavior.
Filter Tags
Some brands and retailers ask reviewers to select “tags” related to the product. These might include pros, cons and best uses of a product – among other, merchant-specific tags. For example, a reviewer might indicate that a con of a pair of shoes is that they’re unfashionable – but a best use is for wearing to work.
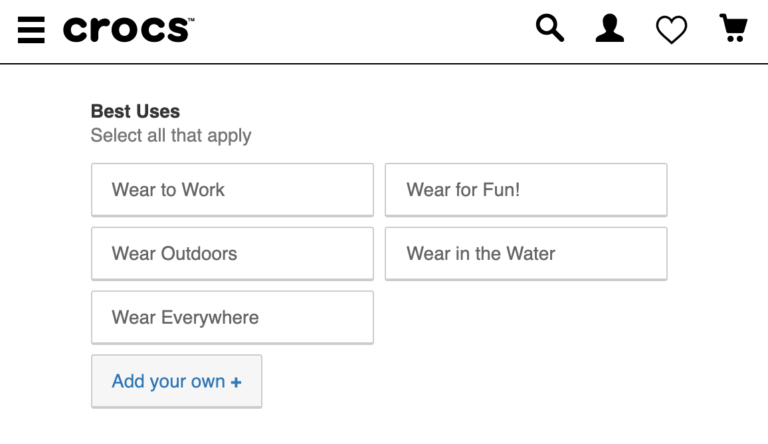
Then, future shoppers can filter reviews using these specific tags. For example, a consumer can click on “wear in water” to see all 16 reviews that list this as a best use for the product.
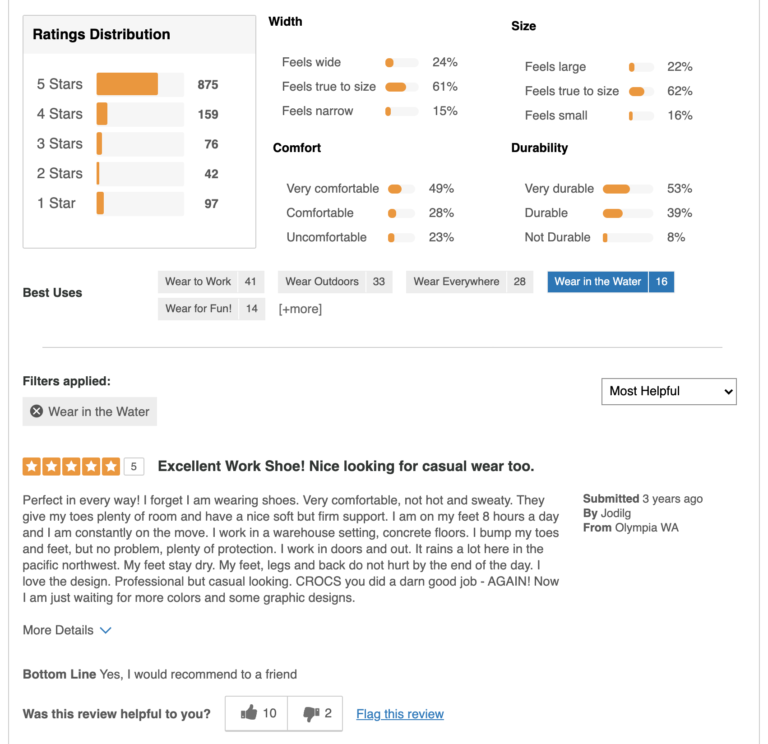
In 2022, site visitors who used tag filtering converted at a rate that’s 84.4% higher than average. This is up from a 78.6% lift in conversion in 2021.
Star Filters
Many review displays include functionality that allows visitors to drill down reviews by star rating. Visitors can see how many reviews are available for each star rating. Then, they can click on a star rating to see only the content with that particular rating.
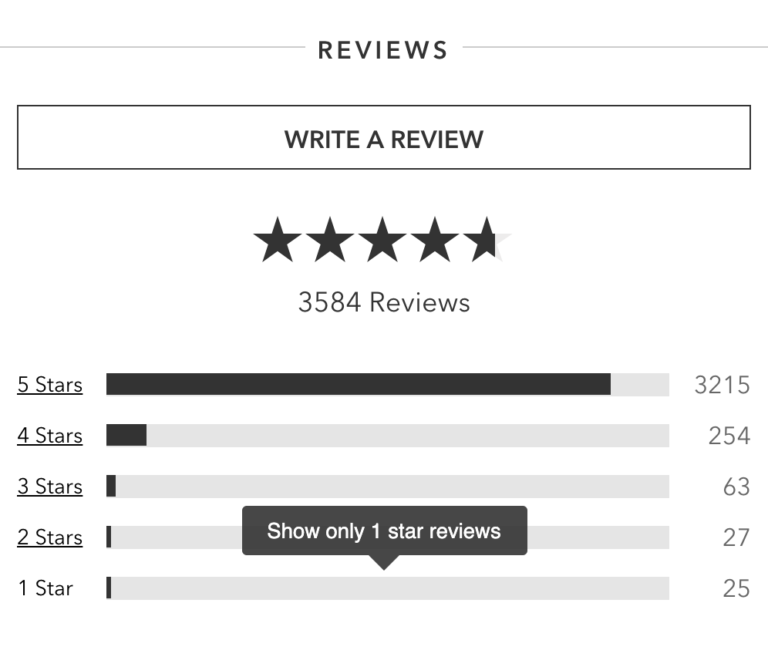
There’s an 81.8% lift in conversion among visitors who take the action of filtering reviews by any star rating.
When it comes to conversion, does the star rating selected by the visitor matter? Take a look at the graphic below and you’ll see the answer is yes.
Filtering by one-star reviews is the most common way for shoppers to engage with rating filters. That’s not surprising. A recent survey found that nearly all (96%) of shoppers seek out negative reviews. 52% specifically look for one-star reviews.
Brands and retailers may think this is a bad thing. If a shopper sees all the negative reviews for a product, surely it’ll scare them away, right? Wrong.
In reality, visitors who filter to see one-star reviews convert at a rate that’s significantly higher than average. There’s a 71.9% lift in conversion among visitors who click to see only one-star reviews.
Clearly, negative reviews aren’t a deterrent. Rather, they’re an important tool that help shoppers find the right products – and make informed purchase decisions.
Read More
In some cases, shoppers can expand a review to get additional details.
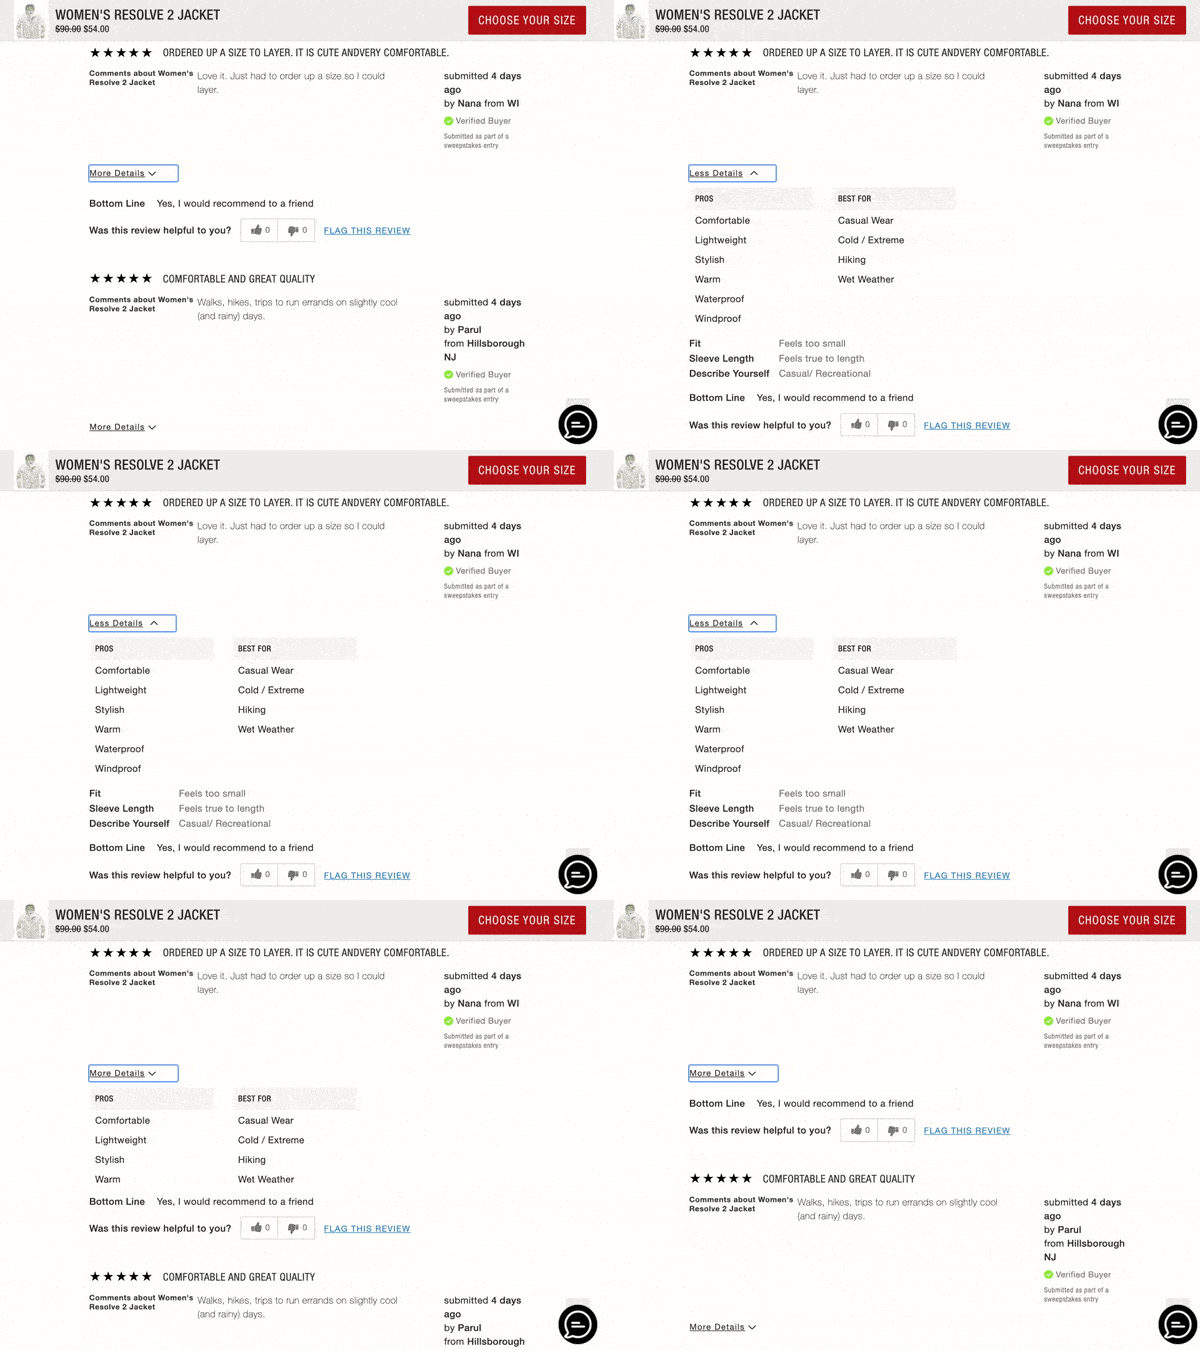
In 2022, there was a 65.6% lift in conversion among visitors who clicked to expand a review to get more details. This is up significantly from 2021, when there was a 50% conversion lift for this interaction.
How Q&A Interactions Drive Conversion
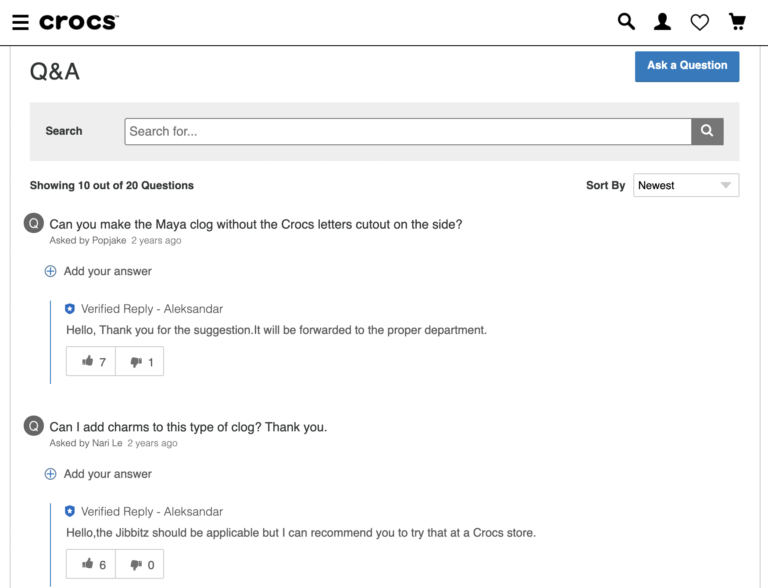
In-store shoppers have the opportunity to ask questions and get product recommendations. Online shoppers don’t have that opportunity.
Increasingly, brands and retailers are bridging the gap by incorporating a questions and answers (Q&A) section onto product pages. This functionality allows shoppers to browse questions that have already been asked and answered. Of course, shoppers can also submit their own queries.
Q&A Reigns as the Most Powerful Conversion Booster
In the two previous editions of this report, we found that Q&A was the type of UGC with the most significant impact on conversion. This is still true.
In 2022, there was a 177.2% lift in conversion among visitors who interacted with Q&A in some way. While this is down slightly from 2021, it is still extremely significant.
Brands and retailers that don’t incorporate Q&A into their product pages are missing out on a simple – yet hugely impactful – opportunity to grow conversion.
How Different Q&A Interactions Drive Conversion
Each Q&A display incorporates features and functionality to make it easier for shoppers to consume existing content and submit their own. The ways consumers interact with these features impact conversion.
Below is a high level overview of how various features and functionality impact conversion. Then, we’ll take a closer look at each.
Show More Answers
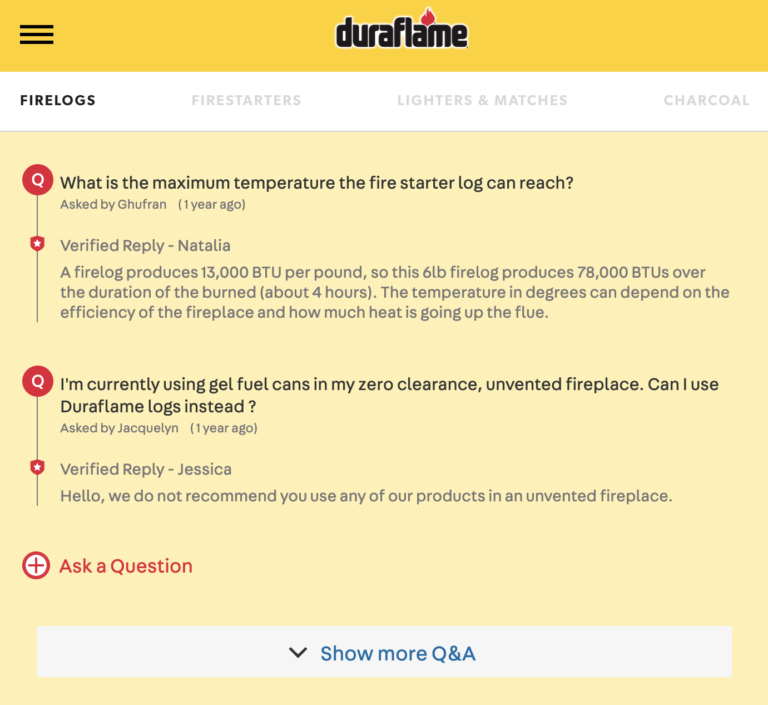
A set number of questions and answers appear in a given Q&A display. A shopper can then click on text that says “Show more Q&A” to access additional content – if it exists.
Shoppers that seek out additional Q&A beyond the initially displayed content are interested in learning as much as they can about a product. These folks are also more likely to make a purchase. There’s a 178.1% lift in conversion among shoppers who click “Show more Q&A” – making it one of the two most impactful Q&A features on conversion.
Click Read Answers
Typically, a single answer is displayed for a question submitted via Q&A. But, there are circumstances when there may be multiple answers available to a single question. For instance, a single question may have a response from the brand, in addition to one from a previous customer sharing their perspective. Visitors can see additional responses (if they’re available) by clicking on “show 1 more answer.”
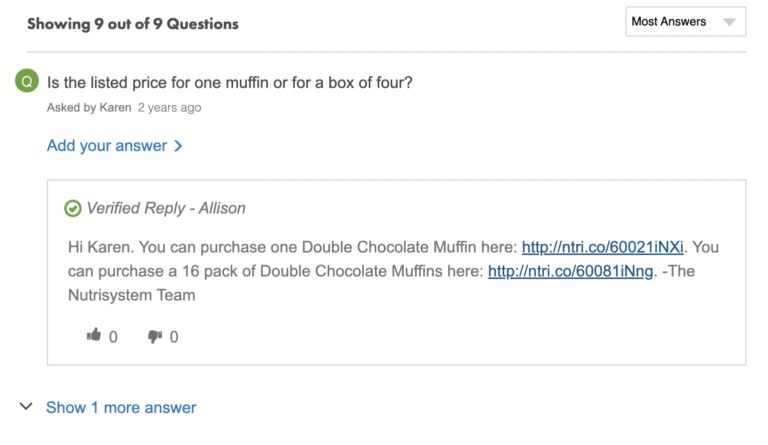
Those who do so convert at a rate that’s 178.1% higher than average.
Answer Helpful
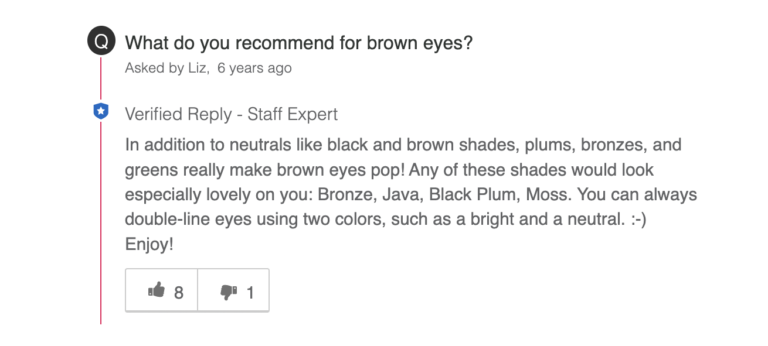
In some cases, a site visitor might find a specific answer to a question to be especially helpful in their purchase journey. It may even be the factor that led to them confidently clicking “add to cart.”
If so, the shopper can tap or click the thumbs up icon to indicate it was helpful. This helps future shoppers quickly identify the most helpful content.
There’s a 165.6% lift in conversion among site visitors who click the icon indicating an answer was helpful.
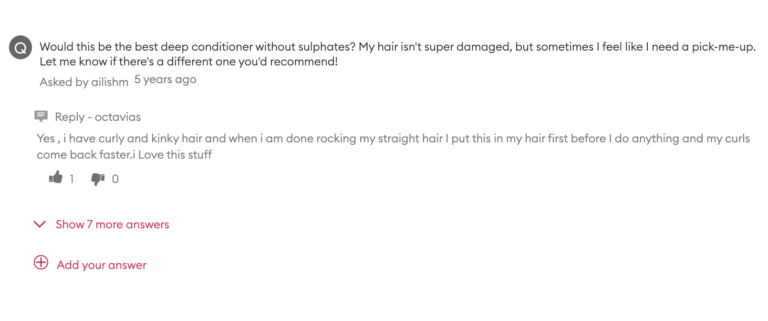
Answer Question
Of course, brand-provided responses to questions are extremely helpful. But a growing number of brands and retailers are also allowing existing customers to answer questions about products they’ve purchased in the past. This makes sense because consumers trust their peers. Research tells us 94% of consumers value answers to Q&A that are posted by other consumers who have already purchased the product.
Some Q&A displays allow customers to submit their answer to an existing question by clicking on the text that says “add your answer.” There’s a 131.3% lift in conversion among those who do.
Ask Question Snippet
A best practice is to include a UGC overview – also referred to as a snippet – at the top of product pages. This snippet provides a high level summary of the UGC available for the product, including the item’s average star rating and review count – as well as the number of answered questions. Some brands and retailers also incorporate a link for shoppers to click to ask their own question.
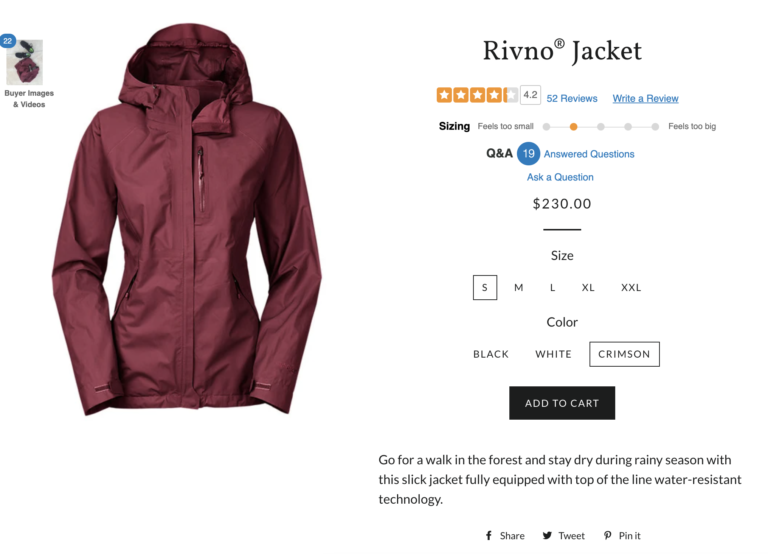
There is a 103.1% lift in conversion among site visitors who click on “Ask a Question” in the UGC snippet.
Ask Question Header
Another way shoppers can submit a question is to click or tap the “Ask a Question” button in the Q&A header. Those who do so convert at a rate that’s 93.8% higher than average.
How User-Generated Imagery Impacts Purchase Behavior
We know from previous research that over three-quarters (77%) of consumers always or regularly seek out photos and videos from others who have actually purchased the product in question.
Interacting with this content boosts shoppers’ confidence – and the likelihood of making a purchase. We see a 6.5% conversion rate among site visitors who interact with user-generated visual content – which is a 103.9% lift in conversion!
A Closer Look at How Interactions with User-Generated Visual Content Boost Conversion
Clearly, user-generated visual content has the power to significantly increase conversion rates. Now, let’s take a closer look at how different forms of visual content interaction impact conversion.
Image Gallery
Increasingly, consumers seek out photos and videos from other consumers who have purchased a given product. It’s a best practice to showcase this imagery in a visual content gallery on your product pages. Doing so is an important way to boost confidence – and purchase likelihood.
In 2022, there was a 103.1% in conversion among site visitors who clicked on any image within a visual content gallery.
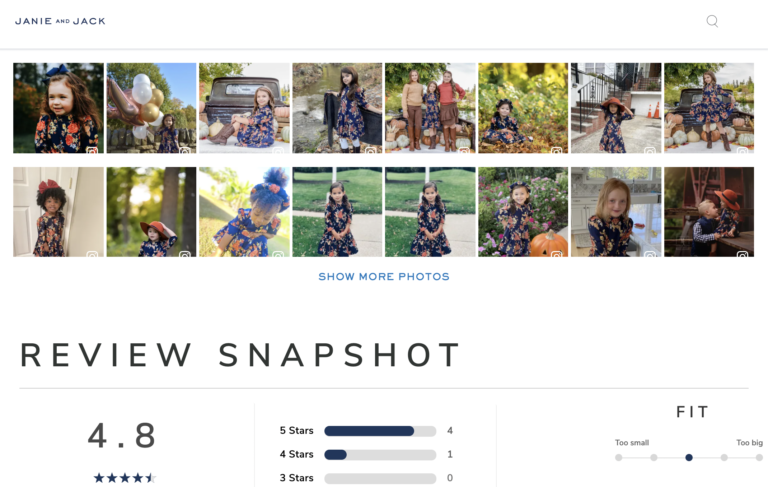
Image Gallery Navigation
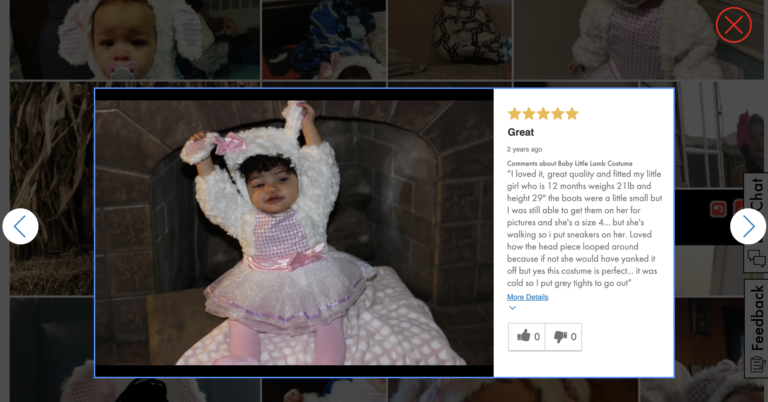
An image or video in an image gallery captures a shoppers’ attention, so they click on it to make it larger. Once they’re satisfied, they may opt to view other imagery by clicking on the forward and backward arrows.
There’s a 106.3% conversion lift among visitors who click the arrow to see the next image – which is up slightly from 2021. On the other hand, there’s a 93.8% conversion lift among those who click the backward arrow to see the previous image.
5 Key Takeaways for Maximizing the Conversion Impact of UGC
User-generated content is an expected part of the purchase journey. It’s also a powerful tool proven to drive significant impact on conversion.
The following are our top five key takeaways from this new analysis.
The simple act of displaying UGC impacts conversion. There’s a 3.8% conversion lift among shoppers who scroll a product page long enough to be served up some type of UGC. The conversion lift is significantly higher – 102.4% – among shoppers who interact with that content in some manner.
While UGC was once a nice-to-have, it’s now a must-have. Brands and retailers that don’t collect and display this content are missing out on a simple, yet powerful way to drive sales.
There are many benefits to online shopping. But a downside is that there’s some risk involved with purchasing a product sight unseen. Reading ratings and reviews helps online shoppers mitigate this risk – and increase their purchase likelihood. Case in point? There’s a 108.6% conversion lift among shoppers who interact with ratings and reviews on product pages.
If you’re not already collecting reviews, start doing so ASAP. If you are collecting reviews, look for ways to collect more. In both cases, develop a winning, conversion-boosting review display. Be sure to incorporate features and functionality that make it easy for shoppers to hone in on the content that’s most relevant to them. A great place to start is to try out the myriad features that are proven to drive the largest impact to conversion.
In-store shoppers can ask questions in-person. Online shoppers don’t have that luxury. Instead, many are turning to the Q&A portion of product pages to browse existing questions and ask their own. We know from previous research that 72% of online shoppers always or regularly read Q&A. And 68% submit their own.
Those who interact with Q&A also convert at a rate that’s 177.2% higher than average. This makes it the most impactful form of UGC on conversion yet again.
Consider adding a Q&A portion to your product pages. It’s a sure way to address purchase blocking questions and boost conversion. If you already have Q&A on your product pages, consider optimizing your display with conversion-boosting features and functionality.
Brand-provided imagery still has a role to play. But increasingly, consumers seek out visual content from others like them who have already purchased and used the product in question.
This visual content has a huge impact on conversion. There’s a 103.9% increase in conversion among visitors who interact with user-generated photos and videos.
This year, make it a priority to collect more photos and videos from your shoppers. You can do so by including a request for imagery in your write-a-review form. You can also curate this content directly from Instagram. Then, be sure to feature your user-generated visual content in a gallery on your product pages so it’s easy for your shoppers to find and consume.
Throughout this report, we dove deep into how various UGC features impact conversion overall. But remember: there’s no “one site fits all” UGC display that should be adopted by all brands and retailers. What works for one business may not for another.
Ongoing measurement is key. Your UGC provider should offer robust reporting capabilities that allow you to easily determine how each type of UGC (and its corresponding features) impacts your conversion rates. You can also see which features aren’t making much of an impact. Armed with these insights, you can make impactful optimizations that’ll drive an even bigger boost to your conversion rates – and your bottom line.

