This is the Cyber 5 special edition of our monthly snapshot, an analysis of consumer activity on the weekend from Thanksgiving thru Cyber Monday across more than 1.5MM online product pages from more than 1,200 retail/brand sites.
This is old news but worth reiterating due to knock-on Holiday impact: the effect of Covid on ecommerce activity has been immense.
To recap, a huge initial surge led to an overall 3x increase in online purchase volumes between February (pre-pandemic) to May. However, the subsequent four months through to October led to a steady decline and then stabilization, with purchase volumes consistently between 40% and 70% higher than they were pre-pandemic (we actually re-aligned our reports to three month periods due to this stabilization).
We then saw a slight uptick in preparation for the Holidays (remember: shopping was expected to start early this year).
We expected shopping volumes to be much higher over the Black Friday – Cyber Monday weekend. But due to the unprecedented nature of Covid, we had no idea how much higher.
So let’s see what our data said about the recent Cyber 5 weekend.
Key ecommerce market trends
01
02
03
Cyber 5 ecommerce volumes surge at far more pronounced rate in 2020 than in 2019
Prior to the Holidays, consumer behavior has clearly become more predictable, with purchase volumes consistently at around 1.4x to 1.7x where they were at the start of the pandemic (this was after a giant surge in April, May and June). So remember that is the baseline we’re dealing with in the chart below.
Why? At the risk of using a very overused Covid phrase, this is most likely because the entire population has settled into a “new normal”. People are no longer buying in the bulk they were because they have confidence in the supply chain and product availability.
But the Holidays brought us into uncharted territory. Typically, we can predict online shopping volumes will increase but this Holiday period is completely unprecedented for obvious reasons.
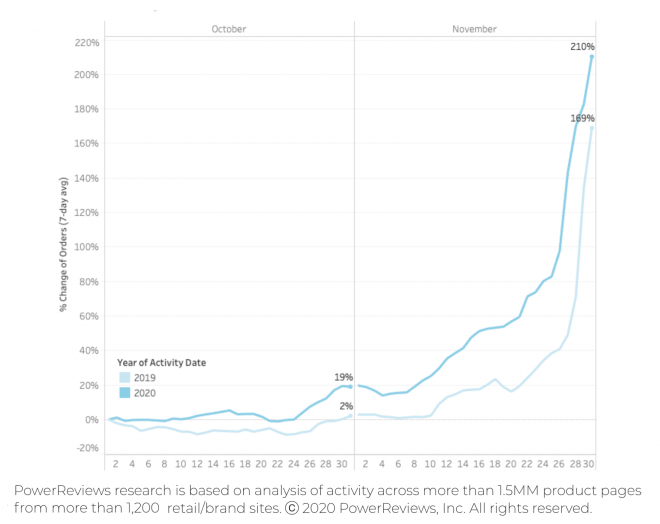
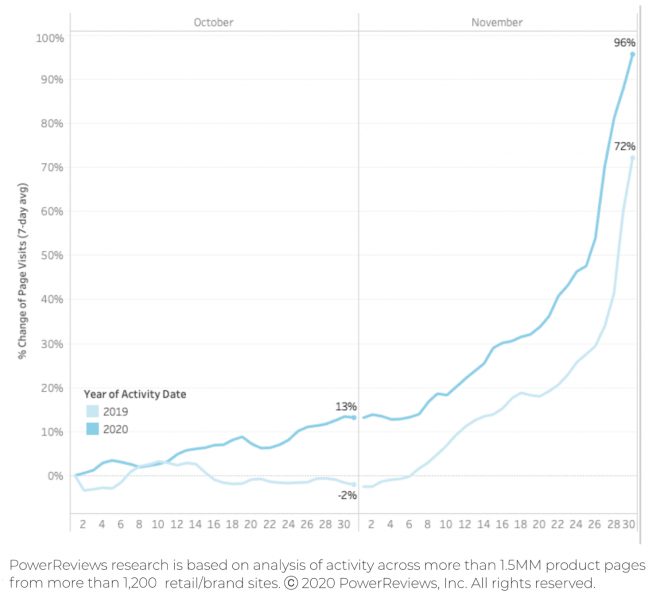
Below we compare the increase in online purchase and traffic volumes for the Cyber 5 weekend (again: bear in mind this jump is coming off a baseline of between roughly 1.4x and 1.7x higher in 2020 than in 2019).
The increase was significantly higher in this period in 2020 in comparison to 2019, with purchase volumes surging 210% this year compared to 169% last. This represented a vivid Covid-driven difference.
Online purchase volumes surge far more pronounced in 2020 than 2019
Site traffic surge mirrors purchase levels year-on-year
Review submission volumes unaltered by Holiday
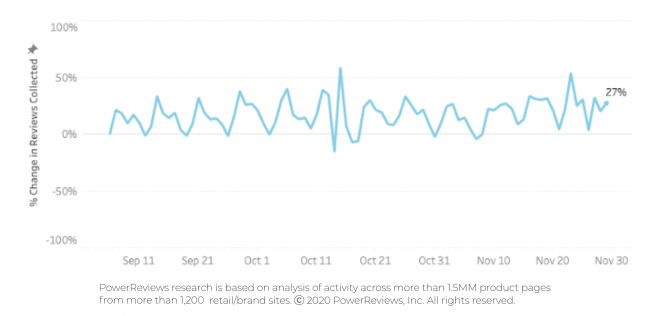
After reporting a giant 2.3x leap in review submission levels from April to May, we subsequently highlighted a consistent drop through to September to the point where levels are now consistent with what we saw pre-pandemic. The Black Friday-Cyber Monday weekend had little impact on review submission volumes or length.
This makes sense: review submission typically lags behind purchase. We would therefore expect these to start rising in mid December.
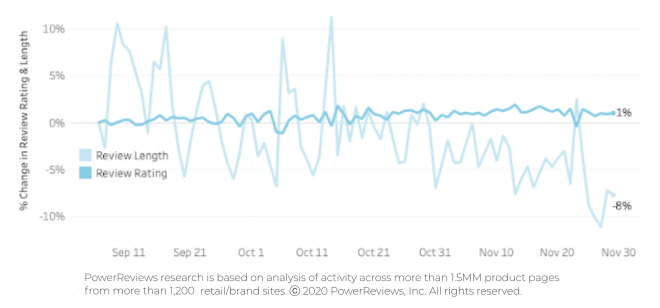
In terms of the actual content of reviews, there have not been any huge shifts over the past seven months. Product rating is consistently flat. This is probably because the products themselves don’t change significantly.
The fluctuations in length of review content submitted are only very modest (bear in mind the scale here is between +10% and -10%). This has been consistent since we started measuring back in April.
No significant variations in review submission levels
Review length relatively stable through Thanksgiving weekend
Reviews consistently more important than pre-COVID, but peak at almost identical height as 2019 Cyber 5
Last month, we did a deep dive into the impact of review content on the buyer journey.
The charts in this section highlight the percentage of online shoppers who go onto purchase after they’ve interacted with review content (i.e. searched, filtered, clicked to extend the review from preview to view entire content etc.)
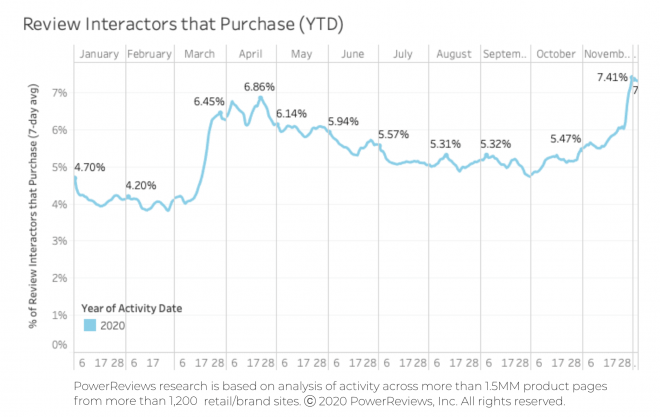
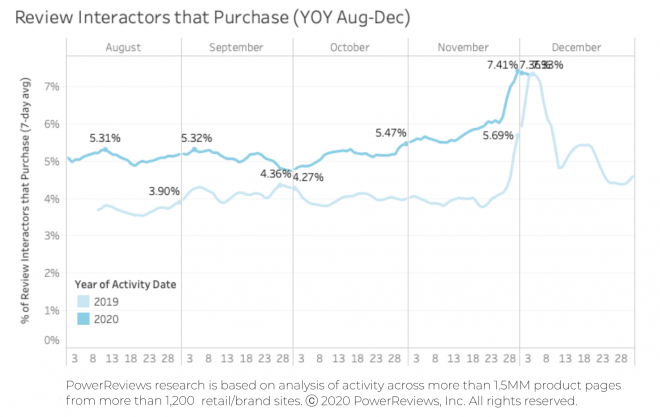
We found that review interactors were consistently converting at around a 25% higher rate than they were a year ago (the conversion figure is typically around 5.25% in the three months prior to Black Friday, compared to around 4.25% in the same period for in 2019).
For context, this figure had come down from its Covid peak (as also demonstrated below) of 6.85% in April. This is in line with when we saw the highest ecommerce purchase volumes (as mentioned, they hit a peak of 210% above where they were pre-Covid at this time).
However, the influence of reviews surged to their highest rate of the year during the Cyber 5, with 7.41% of review interactors going on to purchase (an increase of 30%). As you can see from the charts, this is entirely in line with typical trends. Reviews always become more impactful on the buyer journey during the Holidays.
But – interestingly and despite their generally increased importance during Covid – they topped out at an almost identical level to for the same period in 2019. Given the clear long-term trends evident in the data, we would expect stabilization at the 5.25% level we’ve consistently seen throughout 2020 as we move out of the Holiday period.
Review influence hits year high in Cyber 5, but now consistently more impactful than pre-Covid
Review influence almost identical on 2019 and 2020 Cyber 5 weekend
Summary
Analysts speculated extensively about the potential Covid impact on ecommerce Holiday trends. Well, now the results are in.
There were significant surges in both online purchase volumes and traffic, the likes of which we only saw right at the start of the pandemic (when the 3x increase came off a lower baseline figure). It being the Holidays, this increase was more expected. But the extent and velocity of the surge is still breathaking.
Ratings and reviews have become more influential on the buyer journey throughout the pandemic. In fact, interactors with review content have consistently converted at around a 25% higher rate than in 2019.
The Holidays is also historically a time when consumers rely more on ratings and reviews to make purchase decisions. This year was no exception, with 7.41% of review interactors going onto purchase (compared to 5.41% at the end of October). This is an almost identical Cyber 5 peak to 2019.
However, we don’t expect this to alter the overall trend we’ve seen throughout this year. More people are spending more money online – and they rely more on ratings and reviews to make their purchase decisions than ever before.


