This is the eighth edition of our monthly snapshot, an analysis of consumer activity across more than 1.5MM online product pages from more than 1,200 retail/brand sites.
The impact of COVID on ecommerce has been fairly clear to pinpoint. A huge initial surge led to an overall 3x increase in online purchase volumes between February (pre-pandemic) to May. However, the subsequent four months through to September led to a steady decline and then stabilization, with purchase volumes consistently between 40% and 70% higher than they were pre-pandemic.
Due to this stabilization, we re-aligned our reports to three month periods. In this report, we wanted to see whether the early start to Holiday shopping that consumers had indicated in our survey had borne out.
Our data reveals a clear uptick towards the end of October, which is in somewhat line with these findings.
This month, we also take a closer look at the impact of consumer reviews on shopper buying decisions – and specifically compare our findings year-on-year.
Key ecommerce market trends
01
02
03
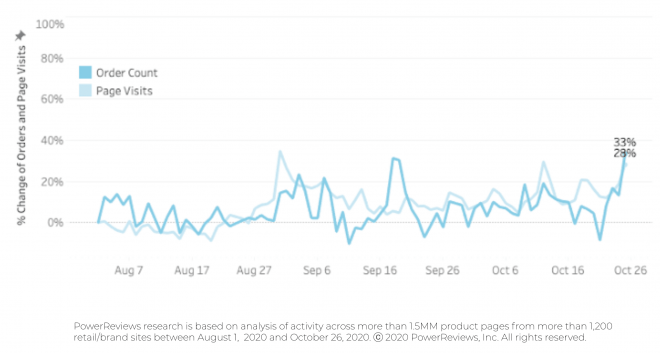
Uptick in purchase volumes and ecommerce traffic in advance of Holidays
Generally, consumer behavior has clearly become more predictable, with purchase volumes consistently at around 1.4x to 1.7x where they were at the start of the pandemic.
Why? At the risk of using a very overused COVID phrase, this is most likely because the entire population has settled into a “new normal”. People are no longer buying in the bulk they were because they have confidence in the supply chain and product availability.
But the Holidays bring us into uncharted territory. Typically, we can predict online shopping volumes will increase but this Holiday period is completely unprecedented for obvious reasons.
In our recent survey, 92% said they would start Holiday shopping either earlier or at the same time as last year.
Toward the end of October, there was clear evidence of an uptick in activity. However, this isn’t especially any earlier than we’d normally expect to see it. And for the most part, both traffic and sales volumes are relatively consistent with where they’ve been since June 2020. So, although consumers were saying they’d spend more earlier this Holiday, this is only partly reflected in our data.
Continued stabilization in both online sales and site traffic
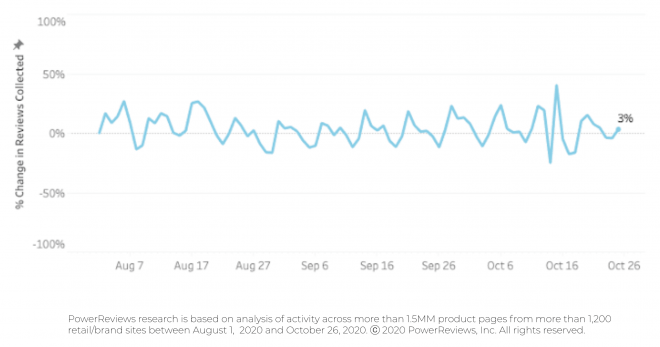
Review submission volumes flat for fourth month straight
After reporting a giant 2.3x leap in review submission levels from April to May, we subsequently highlighted a consistent drop through to September to the point where levels are now consistent with what we saw pre-pandemic. This again continued for the last month.
We hypothesized previously that this is most likely because consumers have now got to the point where they are no longer buying items they hadn’t tried before. Instead, they now have established product preferences so are less inclined to be motivated to submit reviews.
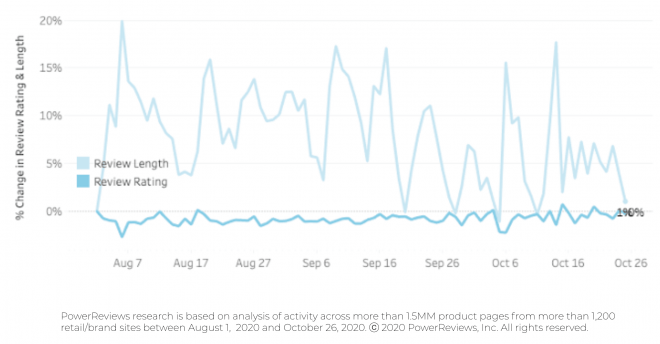
In terms of the actual content of reviews, there have not been any huge shifts over the past six months. Product rating is also consistently flat. This is most likely because the products themselves don’t change significantly.
The fluctuations in length of review content submitted are more pronounced. Due to some fairly significant peaks and troughs, it’s difficult to pinpoint a clear trend here. But this is one we’ll continue to monitor in future months.
No significant variations in review submission levels
Review length fluctuates but sentiment flat throughout pandemic
Reviews more important than pre-COVID, having more impact on conversion
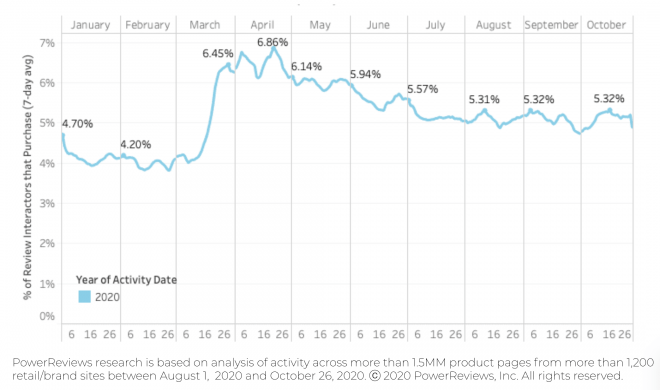
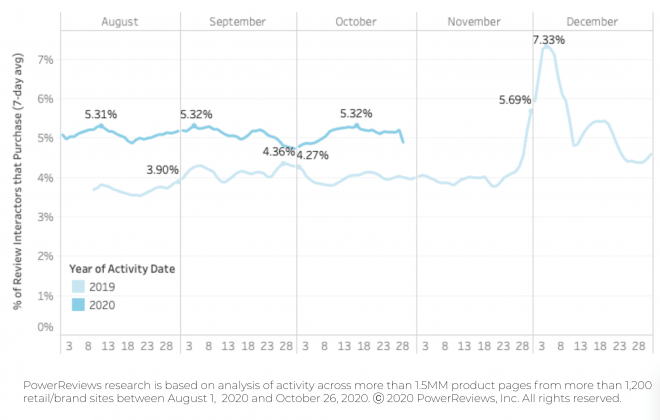
This month, we wanted to dive deeper into the impact of review content on the buyer journey. The three charts in this section highlight the percentage of online shoppers who go onto purchase after they’ve interacted with review content (i.e. searched, filtered, clicked to extend the review from preview to view entire content etc.)
Bottom line: review interactors are converting at around a 25% higher rate than they were a year ago.
According to the first chart below, the conversion figure is consistently around 5.25% over the last three months. A year ago, the same figure was consistently around 4.25%.
For context, this figure has come down from its COVID peak (as also demonstrated below) of 6.85% in April. This is in line with when we saw the highest ecommerce purchase volumes (as mentioned, they hit a peak of 210% above where they were pre-Covid at this time).
Looking ahead, reviews typically become even more influential in the buying process during the holidays. Our chart highlights how they soared in late November/early December last year. We anticipate the same happening this time out. Based on what we’ve seen so far this year, we’d expect them to be even more important during the imminent Holiday period.
Reviews significantly more important year-on-year
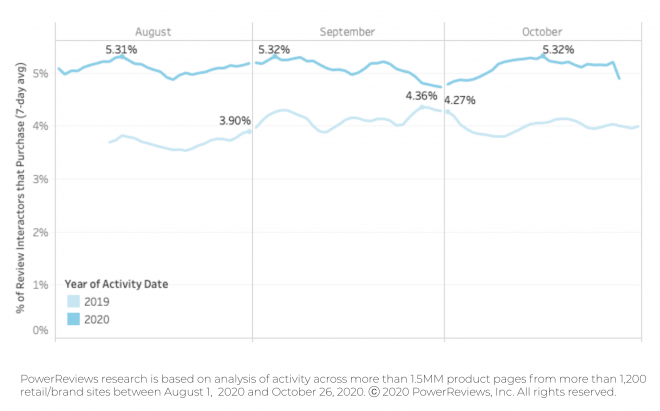
Reviews most influential in April, but now consistently more impactful than pre-Covid
Review importance likely to peak during Holidays
Summary
At the start of October, we saw continued stabilization. As the month wore on, purchase volumes did pick up – a trend we expect to continue in the build-up to the Holidays.
As we all know, the Holidays are the biggest time of year for ecommerce and retail. And our research indicates, predictably, that this will actually be the biggest Holiday season ever for ecommerce. We are therefore anticipating a huge surge in traffic and purchase volumes throughout November.
In this report, we explored the growth in the impact of review content on the buyer journey. Significantly, this is now roughly a quarter more important in driving sales on ecommerce product pages than a year ago – a notable shift. With this impact typically surging to its annual peak during the Holidays, ratings and reviews look set to be more important than ever for shoppers during the Cyber 5/BFCM and beyond.


