Power Points
- Consumers who interact with Ratings & Reviews convert at 120.3% the rate of those who don’t; respective figure for Q&A is 157.1% and imagery is 91.4%
- Consumers who click the “Helpful Yes” button within individual reviews convert at the highest rate of review interactors (314.7% conversion lift), followed by those who click “Foot Page Previous” (288.2% conversion lift)
- When it comes to star filtering, 62.4% of star interactors filter on 1 star reviews (compared to 30.3% for 5 star reviews, the next most commonly filtered). These consumers still convert at 120.3% the rate of typical web visitors
- Consumers who click the “Show More Answers” button convert at 164.7% the rate of general web visitors, making it the most impactful Q&A display interaction feature
- Become outcome obsessed: Become data-led and conversion-first by analyzing your own data and optimizing your UGC strategy accordingly
Contents

User-Generated Content Benefits Consumers and Businesses Alike
Today’s shoppers have come to depend on user-generated content (UGC), including ratings, reviews, Q&A, photos and videos — regardless of the type of product they’re shopping for. And if they don’t find the content they’re looking for on a brand or retailer site, they won’t hesitate to shop elsewhere.
On the other hand, businesses that do provide shoppers with the content they depend on to make smart purchase decisions are rewarded. Collecting and displaying UGC is proven to drive traffic, conversion and sales, while also providing brands with actionable insights they can use to improve products and experiences.
Focus on What’s Important
The positive impact of UGC is no longer debatable. As such, a growing number of customer-centric brands and retailers now make collecting and displaying plenty of this content integral to their ecommerce shopping experience.
But all too often, businesses become so focused on creating brand-aligned, visually appealing UGC displays that they lose sight on what really matters: driving conversion.
So what’s the difference between a great review display that positively impacts conversion — and one that doesn’t?
Myriad UGC Features Impact Conversion
Each UGC display is unique and consists of different features and functionality. For example, while some review displays include a review “faceoff” highlighting the most helpful positive and negative reviews about a particular product, others don’t.
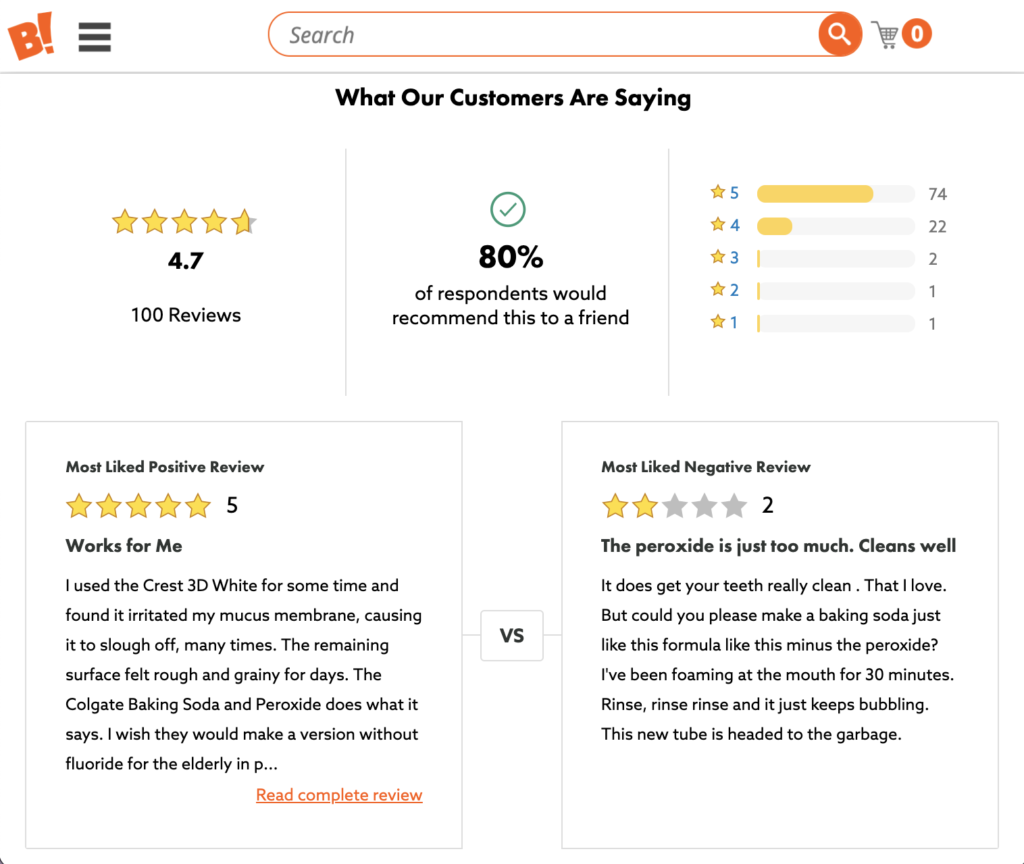
But how are consumers interacting with all of these features? And are these interactions impacting conversion?
PowerReviews analyzed consumer activity during the entire year of 2020 across more than 1.5MM online product pages from more than 1,200 brand and retail sites to find out. Throughout this report, we’ll explore how user-generated content drives conversion for these brands and retailers. And we’ll drill it down all the way to the feature level.
Measure and Optimize Your UGC Display to Drive Bottom Line Results
Remember: There’s no magic, “one size fits all” display that’ll drive conversion across all brands. A feature that’s particularly impactful for one brand or category might not be as effective for others.
As such, it’s important to continuously measure the performance of different components of your own UGC display. You can then use that data to drive optimizations that’ll positively impact your bottom line.
Defining Conversion for this Report
Calculated based on unique visitors who have scrolled the page enough to be served an impression of at least one type of UGC (review, image/video or Q&A). We EXCLUDE what we call our review snippet (the UGC element typically used at the top of PDPs to display a summary of the rating distribution, average rating and so on) from the UGC Impression metric. Throughout this report, we also use this metric to examine the different forms of UGC, specifically reviews, Q&A and visual media (i.e. video or imagery).

Before we dive into the individual features of UGC displays, let’s take a step back and look at the overall impact of UGC on conversion.
The Presence of UGC Positively Impacts Conversion Rates
During 2020, 3.4% of site visitors converted on the 1,200 sites we analyzed using PowerReviews UGC/Ratings and Reviews technology.
This is above typical benchmark conversion rates of the Product Detail Pages (PDP) you may have seen from other sources. There are two main reasons for this.
- How we calculate conversion rate: we base conversion on visitors rather than sessions (see above for our specific methodology).
- Assuming the PDP is built this way, which the overwhelming majority of them are – all shoppers in the data we analyzed are served some form of UGC above the fold (typically, a summary of rating distribution and average rating at the very least). Again, see above for more information on what we classify as a UGC impression or UGC interaction.
Regardless, when visitors scroll a page to the point they are served some form of UGC OR interact with UGC, they are MUCH more likely to convert.
There’s a 4.3% lift in conversion when a visitor is served at least one type of UGC (i.e. our Analytics platform records a visitor UGC impression as per the above definition, which excludes our top-of-page review snippet summary). And there’s a 108.4% conversion lift when a visitor interacts with UGC. We’ll go into more details about the different ways a visitor can interact with UGC later on.
The message here is quite clear: displaying UGC including reviews, Q&A and visual content in itself has a notable impact on conversion. But consumer interaction with UGC has a transformational effect.
But does presenting this information in different formats make a difference? Let’s take a closer look at how different features of each type of UGC can make a difference.

As previously mentioned, 97% of consumers read product ratings and reviews before making a purchase. And as it turns out, when a shopper consumes this content, it significantly impacts their likelihood to purchase.
Reviews Double Conversion Rates
Purchasing a new product is risky. Even if a shopper reads all of the details provided by the brand or retailer, it’s impossible to know with certainty that a product will meet their needs. But when consumers read reviews written by others like them, this feedback often gives them the confidence they need to convert.
In fact, there’s a 120.3% lift in conversion when a shopper interacts with ratings and reviews on a product page.
How Different Review Features Boost Customer Confidence -- and Conversion
Each review display a consumer comes across consists of different features. Let’s examine how some of these key features positively impact a shopper’s likelihood of converting.
Helpful Votes
When a shopper reads a review, they can indicate that the content was helpful (or not) by clicking on the thumbs up or thumbs down icons.
The conversion rate increases by 314.7% among visitors who click the “helpful” icon. And interestingly, there’s a 182.4% conversion lift among those who click the “unhelpful icon”.
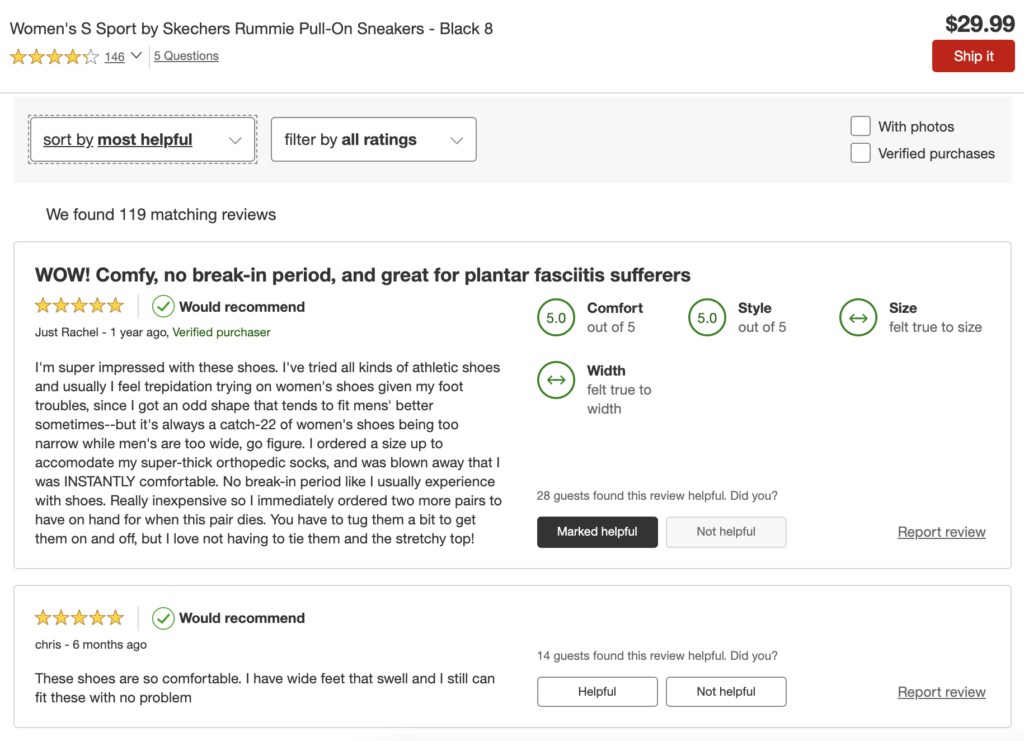
Footer Page
At the bottom of a review display, visitors can typically take a few different actions. They can navigate to the next page of reviews, go back to the previous one or return to the top.
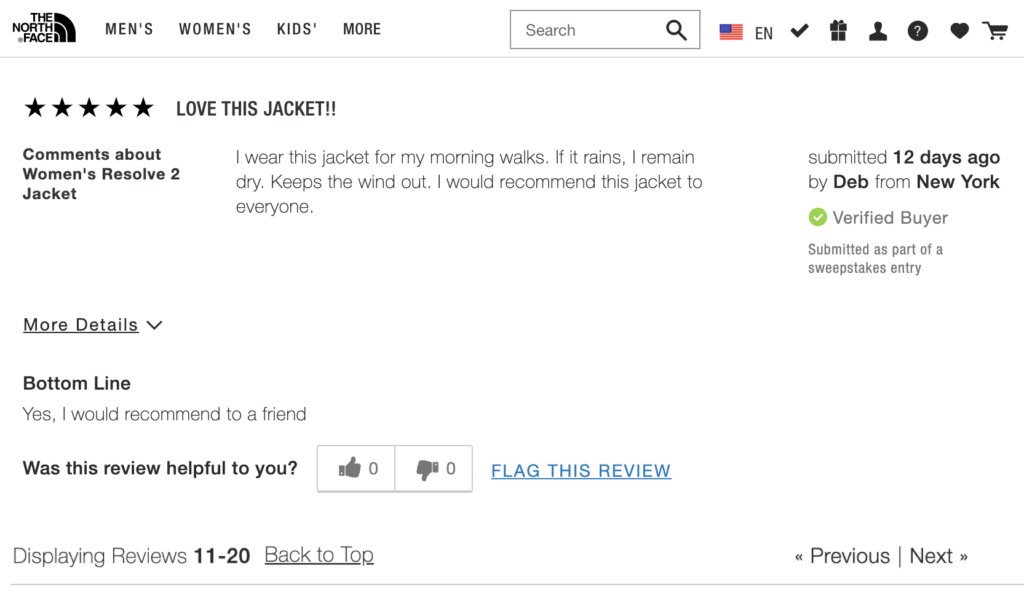
Here’s the conversion lift for shoppers that take each of these actions over those who do not:
Merchant Specific Question Filtering
Some brands and retailers ask merchant-specific questions in their “write a review” forms. For example, a beauty brand might ask a reviewer to include information about their skin type and beauty routine in a review for foundation.
Sometimes, brands also allow shoppers to filter reviews based on the answers to these questions. For example, a visitor can filter reviews to only see content written by those with dry skin.
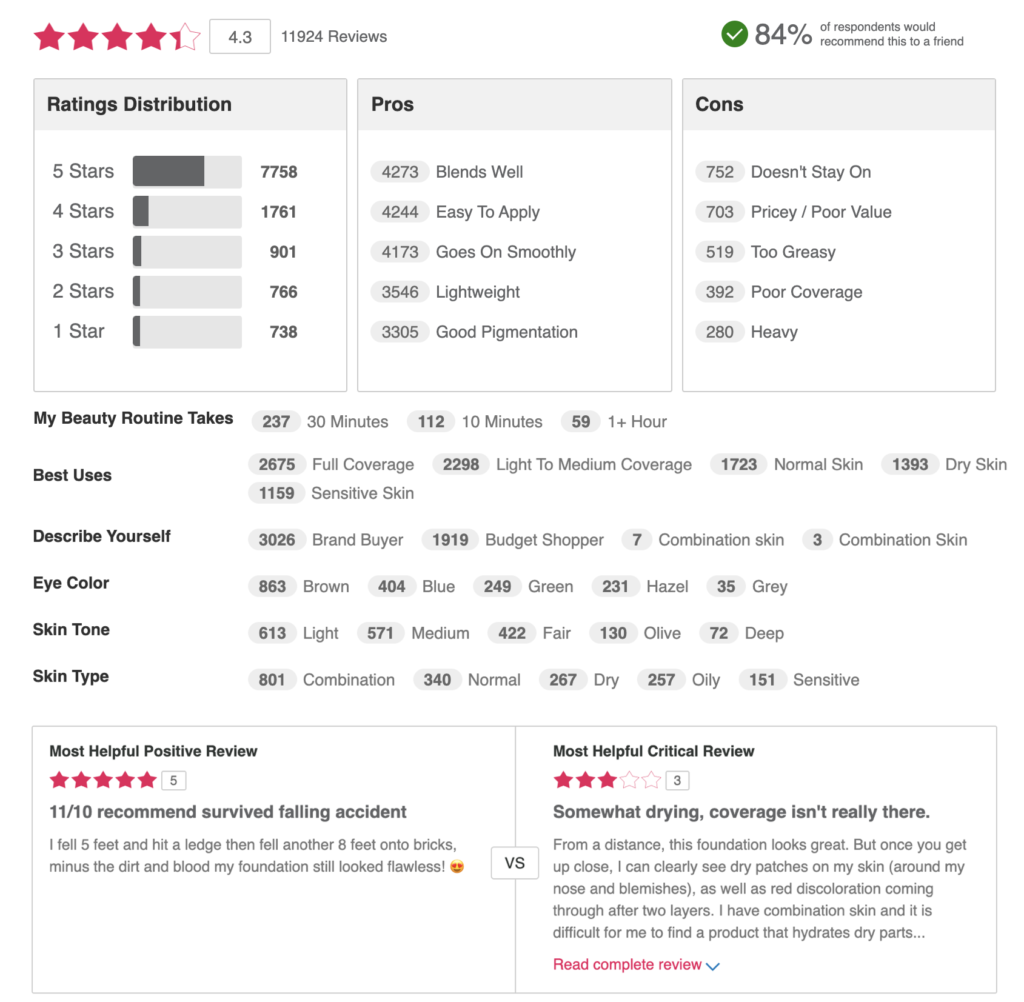
Shoppers who filter by these merchant specific questions end up converting at a rate that’s 270.6% higher than general visitors to the same Product Detail Pages!
Review Search
Many review displays allow shoppers to search for reviews that include specific terms relevant to their needs. For example, a shopper might seek out a vacuum cleaner that’ll effectively clean up her pet cat’s hair. They can type “cat” into the search feature and see all reviews that mention cats.
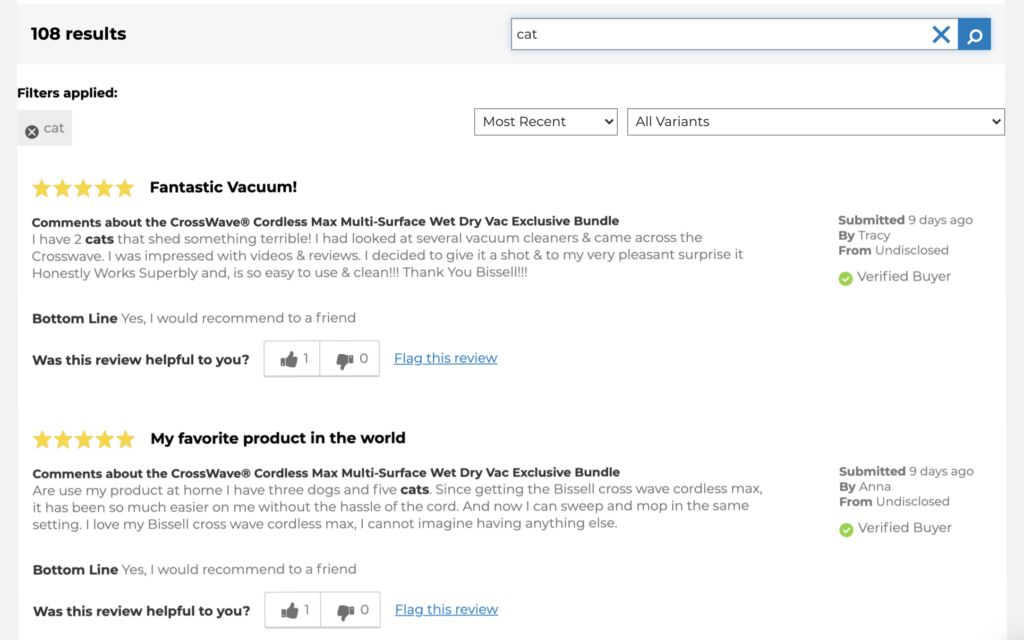
Once the shopper finds reviews relevant to their use case, they’re more likely to make a purchase. In fact, there’s a 202.9% conversion lift among visitors who use the search feature (over general visitors to the same page).
Review Faceoff
A review “faceoff” shows the most liked positive review alongside the most liked negative one. It’s a great way for shoppers to quickly understand the positives and the negatives of the product that have been most helpful for other shoppers to learn about.

There’s a 138.2% conversion lift for those who expand the positive review in the faceoff over general visitors to the same Product Detail Page.
And interestingly, there’s a 120.6% conversion increase among shoppers who click to expand the negative review. This once again proves the value of negative reviews in empowering shoppers to make informed purchase decisions.
Review Snippet
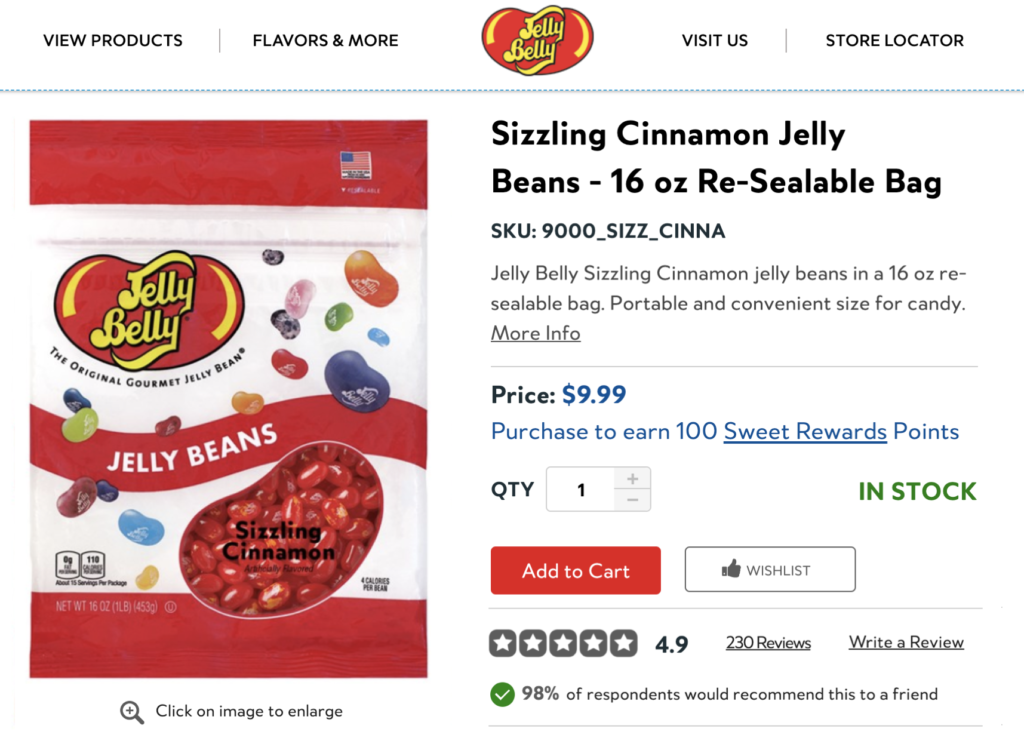
Many brands and retailers display a review “snippet” at the top of the product page. The snippet provides an overview of the reviews available for that product, and typically includes the average star rating, as well as the number of reviews that have been written for that product.
If a shopper interacts with the snippet (aka they click within it), they’re taken to the full review display to get more details. In fact, there’s a 129.4% conversion lift for those who do.
Star Filters
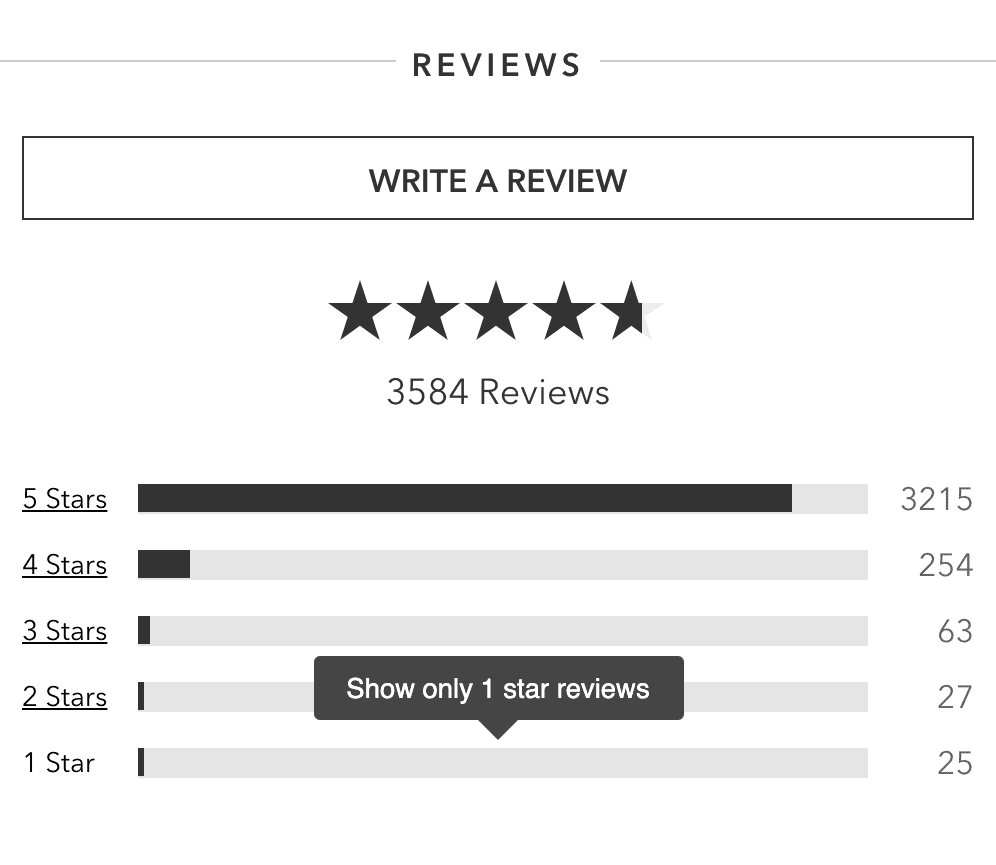
Many review displays provide a breakdown of how many reviews have been written for each star rating. Shoppers can then click on any of the bars to see only reviews of a certain star rating. There’s a 111.8% conversion lift among those who do (in comparison to those who visit the same page and do not).
Here’s an even closer look at how many shoppers filter reviews by specific star ratings — and how that behavior impacts conversion.
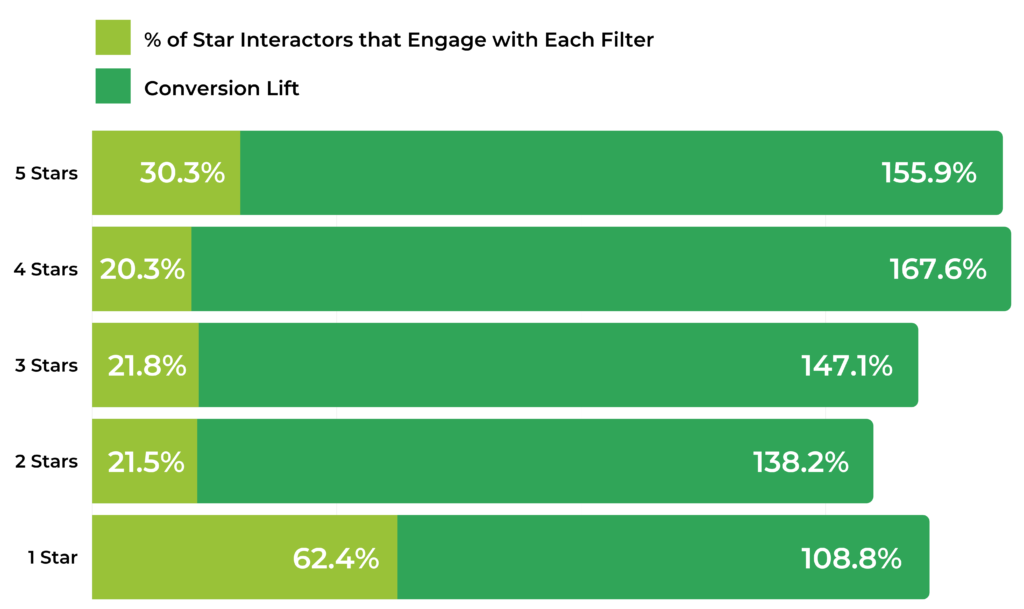
Of note, choosing to see only one-star content is the most common way shoppers filter by star rating.
However, it’s worth noting that visitors who take this action still convert at a rate that’s 108.8% higher than average.
Negative reviews are an important tool shoppers depend on to make informed purchase decisions. This content allows them to understand the worst possible scenario — and determine if they can live with it. And clearly, many don’t let the occasional negative review stand in the way of making a purchase.
Review Sorting
Typically, visitors can sort review content in a number of ways. For example, a visitor can sort reviews by recency — or they can choose to display reviews that include images first.
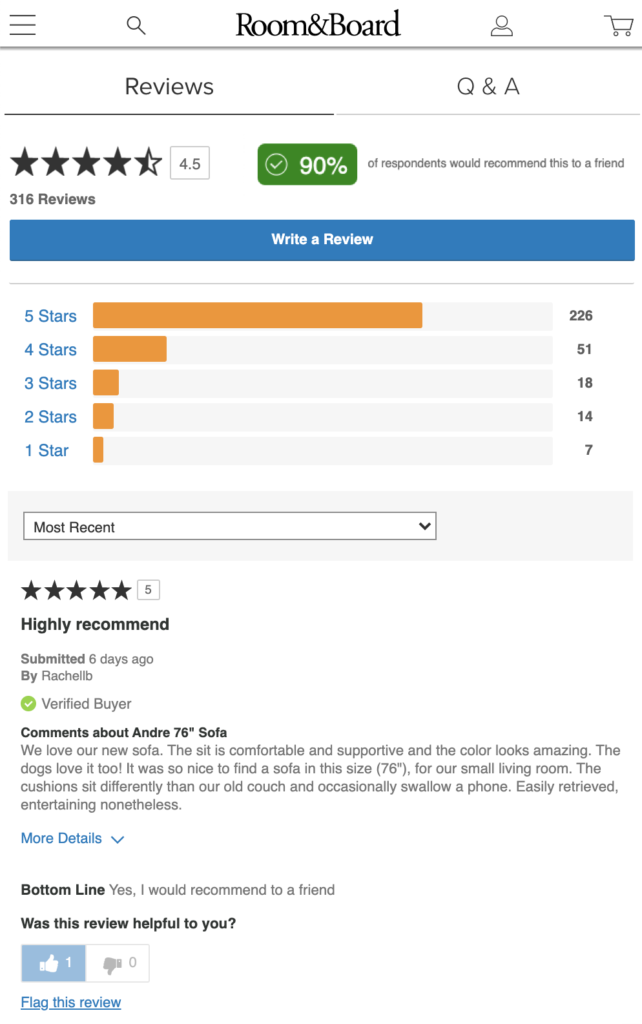
Among those who sort reviews, there’s a 109.7% increase in conversion.
Let’s take a look at how different types of sorting behavior impact conversion.
More Details
Once a shopper has zeroed in on a specific review, they can often expand that review even more to get additional details. For example, when a shopper clicks “more details” on this review for a jacket, they can see the pros and cons of the product, as well as more information about the fit and use cases.
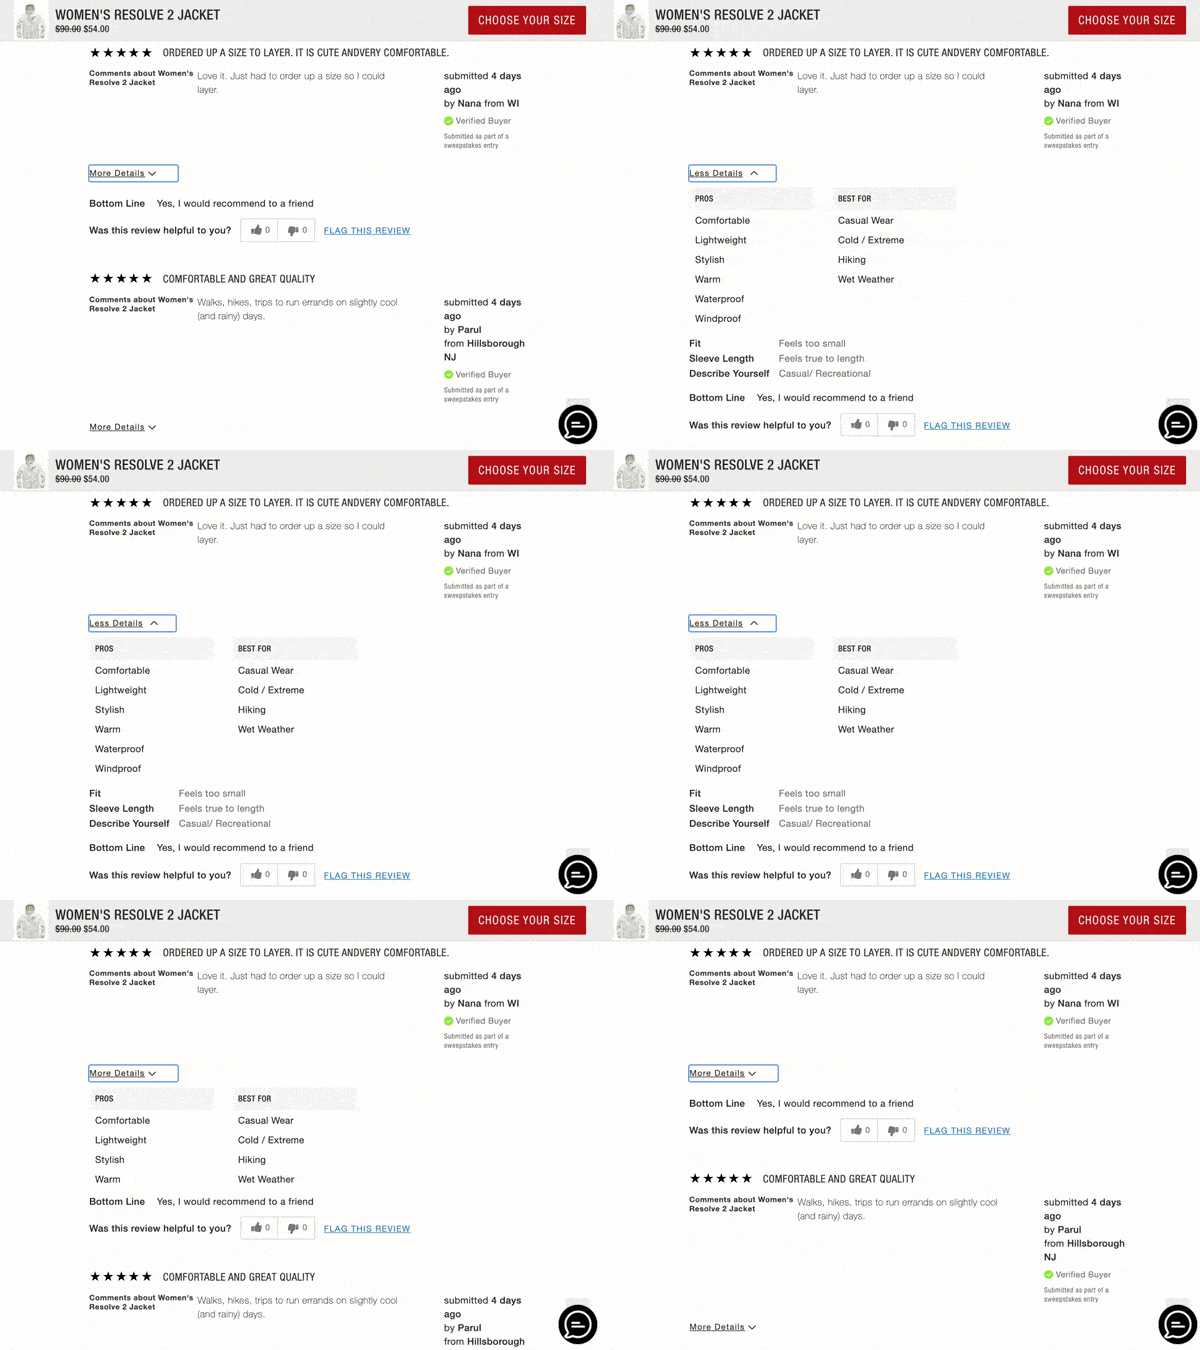
Based on our analysis, there’s an average 105.9% conversion lift for shoppers who click to get more details compared to visitors to the same pages who don’t do so.
Tag Filtering
Some businesses ask reviewers to select the pros, cons and best uses for a specific product.
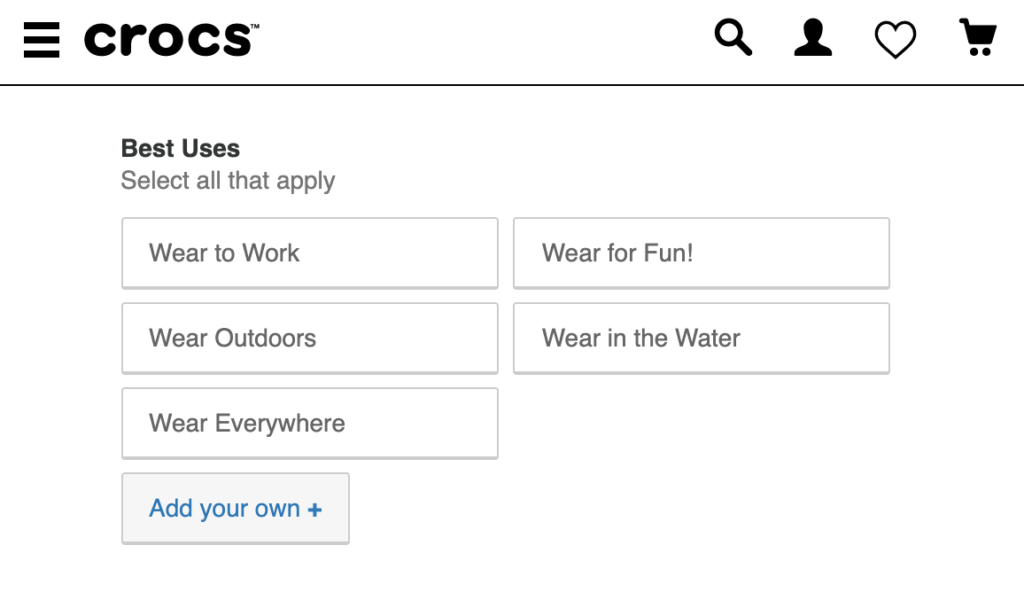
Future shoppers can then filter review content by specific best uses.
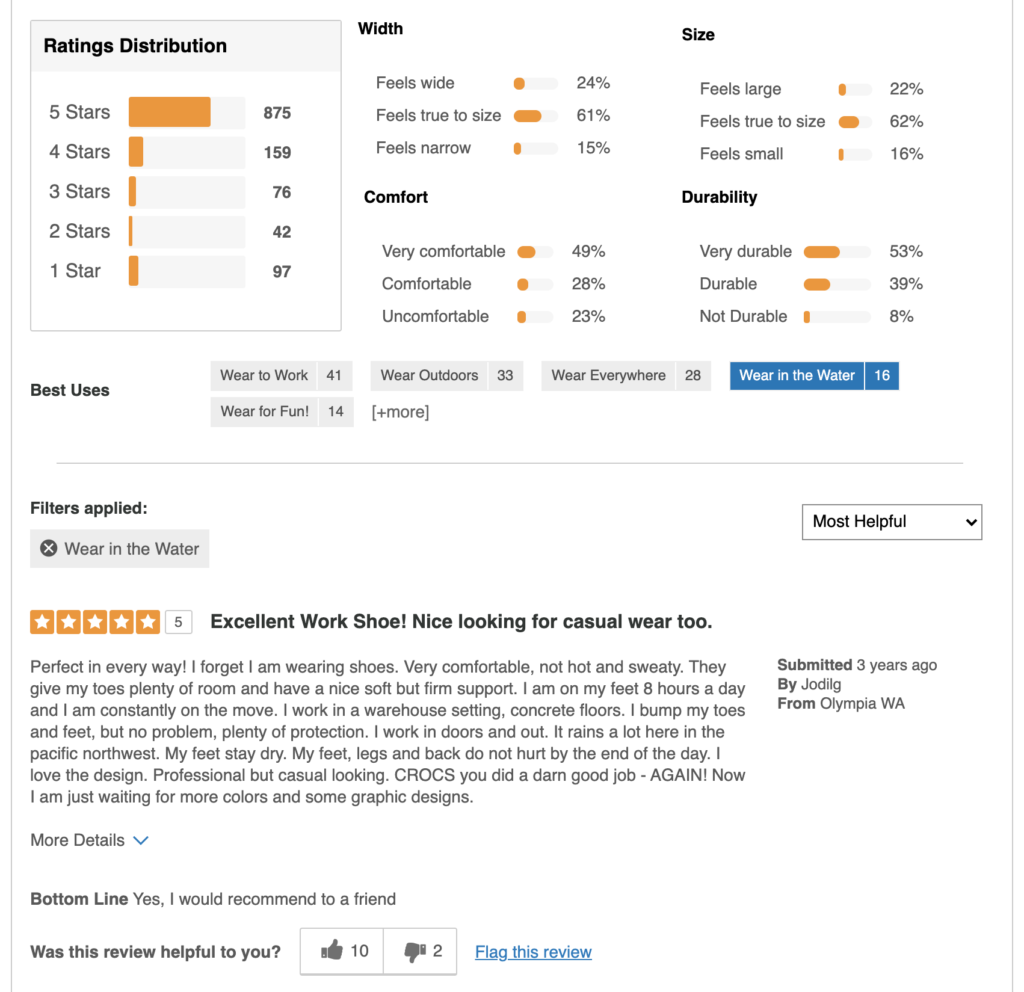
There’s a 35.3% increase in conversion among visitors who take this action. Although this is a notable increase, it’s far less impactful than the 120.3% lift in conversion for all review interactors.
This once again highlights the importance of building your review display according to what the data tells you.
Boost Trust (and Conversion) with Reviews
Reviews drive a 120.3% lift in conversion. And certain review features can impact conversion even more. Be sure you’re measuring the effectiveness of your review display regularly — and use the insights you uncover to make improvements that’ll drive conversion.

No matter how comprehensive your product descriptions, some shoppers will still have questions. When this happens, a shopper is likely to navigate to the Q&A portion of your product page to see if a fellow shopper has gotten an answer to a similar question. And if that’s not the case, the shopper can submit their own question.
And when shoppers interact with Q&A, it has a big impact on their purchase behavior.
Q&A is the Most Impactful Type of UGC
Of all the different types of UGC we analyzed for this report, Q&A is the most impactful. In fact, there’s a 157.1% conversion lift when shoppers interact with the Q&A on a product page!
Various Q&A Interactions Impact Purchase Likelihood
Now, let’s take a look at some examples of different Q&A features shoppers engage with — and how each of these features drive purchase behavior.
Show More Answers
A certain number of questions and answers appear on the product page for a given product. If there are more available, the shopper must click on the text that reads “Show more Q&A” to access them.
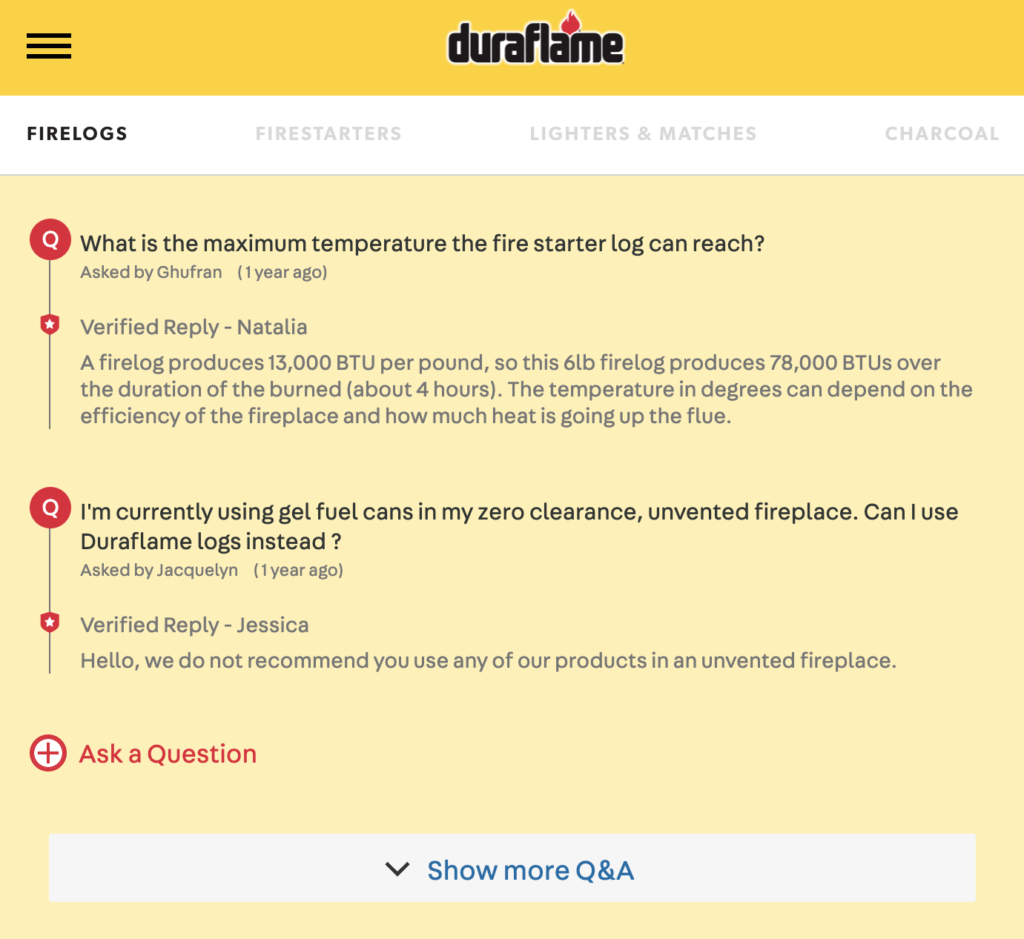
A shopper that scrolls through this additional Q&A content is obviously committed to learning as much as they can about a product. And these shoppers convert at a higher rate than typical. There’s a 164.7% conversion lift when shoppers click “show more answers.”
Click Read Answers
Typically, a single answer is automatically displayed for a question submitted via Q&A. If there are multiple responses (for example, an official brand response as well as one from a previous customer), the shopper must click “show 1 more answer” to see it.
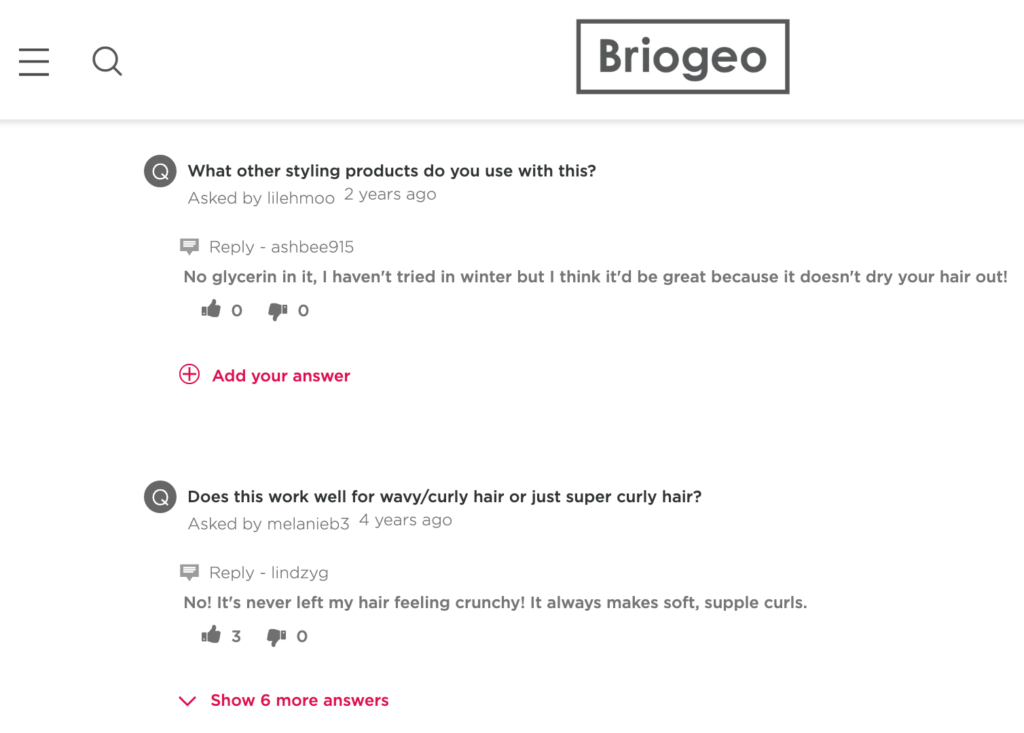
There’s a 158.8% conversion lift among those who take this action.
Answer Helpful
When a shopper reads an answer that’s been provided to a customer question, they can tap or click the thumbs up icon to indicate the answer was helpful to them.
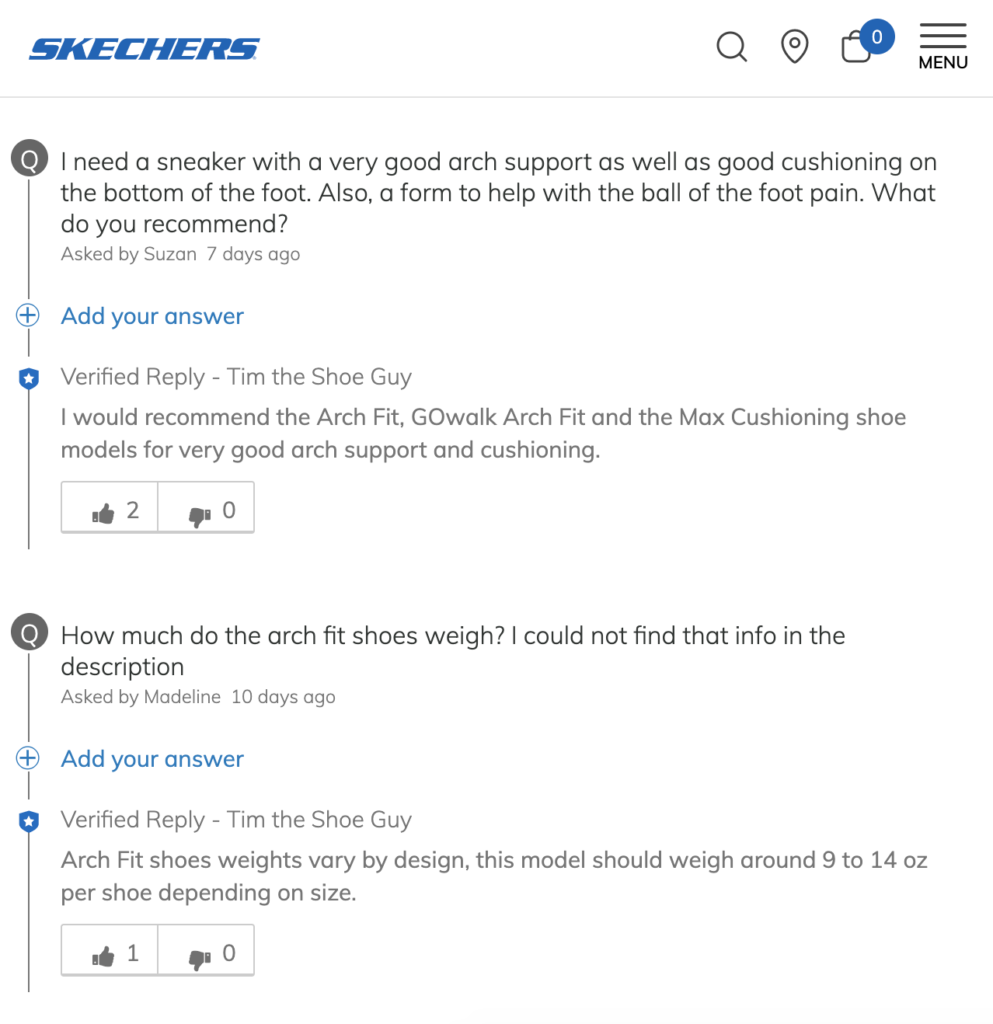
Those who do convert at a level that’s 141.2% higher than average for the page.
Ask Question Snippet
Some brands and retailers display a “snippet” at the top of product pages that gives visitors a high level overview of the UGC available for that product — and provides a link they can click to ask their own product question.
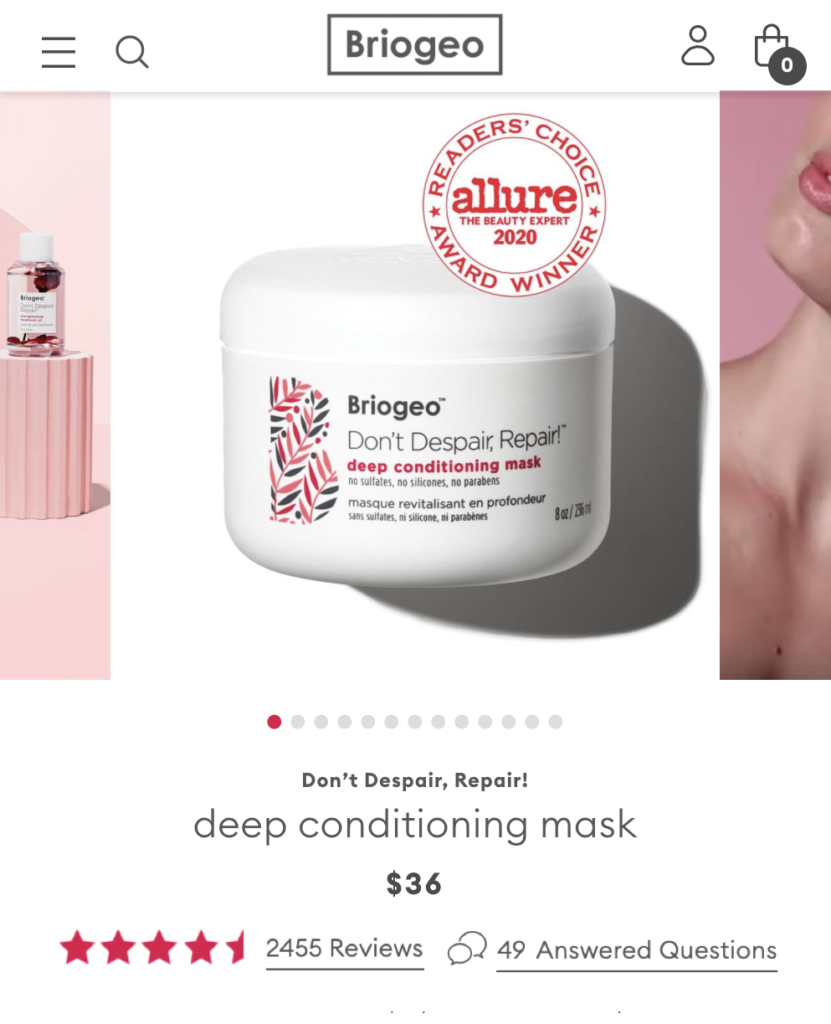
There is a 137.1% increase in conversion among shoppers who click “ask a question” in the UGC snippet.
Answer Question
Some brands and retailers allow different experts to answer the questions submitted via Q&A — including existing customers. A visitor can answer an existing question by clicking on the “add your answer” text.
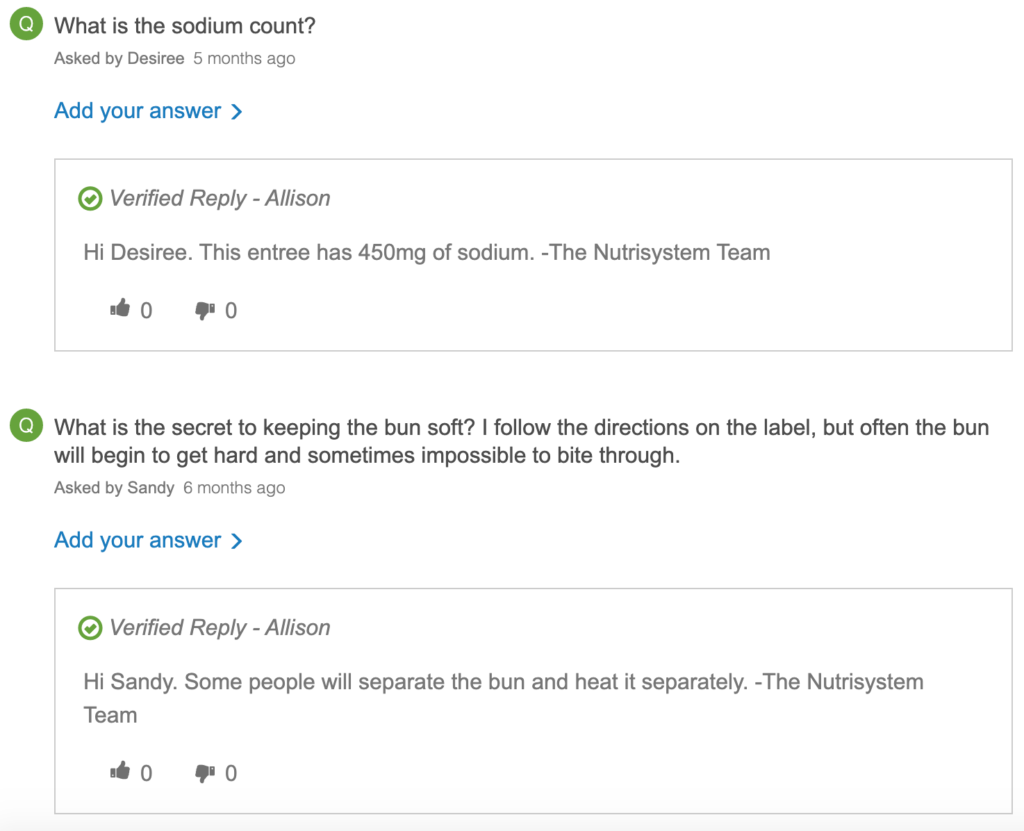
There is a 111.8% conversion lift among shoppers who take this action.
Ask Question Header
Another way shoppers can ask questions is to click on the “ask a question” button of the Q&A header.
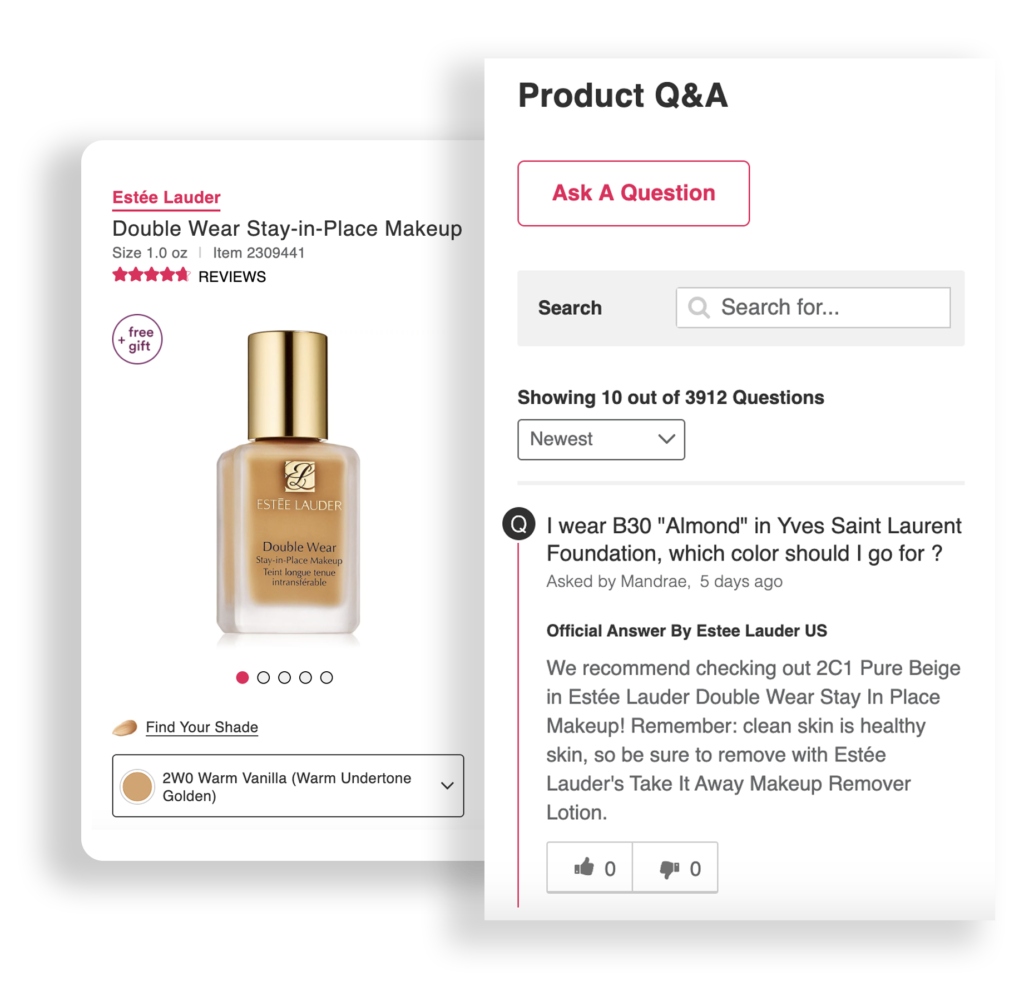
There is a 79.4% increase in conversion when page visitors do this.
Empower Shoppers to Ask Purchase Blocking Questions
Q&A is the most impactful form of user-generated content, driving a 157.1% lift in conversion. If you’re not already, add Q&A to your product pages. Being able to get quick answers to questions (and reading answers to questions that have already been asked) will give your visitors the confidence they need to convert.
Remember: analyze the performance of your Q&A features — and use the data to make impactful optimizations that’ll increase conversion.


Many shoppers look for photos and videos of a product before making a purchase. And increasingly, they’re seeking out this content from others like them. 88% of shoppers specifically look for images and videos provided by other consumers before making a purchase.
And as it turns out, consuming this content positively impacts purchase behavior.
Shoppers Who Interact with Imagery are More Likely to Convert
The overall conversion rate across the brand and retailer sites we analyzed was 3.4%. But when a site visitor interacts with user-generated photos and videos on a product page, the conversion rate goes up to 6.6%. That’s a 91.4% lift in conversion!
Of note, visual content has an even larger impact when a consumer is shopping for products in certain categories that are more visual in nature.
For example, there’s a 119.1% conversion lift when consumers shopping for apparel interact with user-generated imagery. And those who interact with imagery when shopping for home and garden products convert at a rate that’s 149.9% higher than average.
Different Imagery Interactions Drive Conversion
We know that those who interact with user-generated photos and videos convert at a higher level than average. Now, let’s take a closer look at different times of imagery interactions and how they impact conversion.
Image Gallery
It’s a best practice to display photos and videos submitted by shoppers in a gallery on the appropriate product page. Our analysis tells us there’s a 94.1% conversion lift among shoppers who click on any image within that gallery.

Image Gallery Navigation
Once a shopper has enlarged an image or video in the gallery by clicking on it, then can then navigate to other imagery by clicking on the arrows on either side of the image. Those who click to see the next image convert at a rate that’s 91.2% than average. And there’s a 79.4% conversion lift among shoppers who click the “previous image” arrow.

Convert More Shoppers with User-Generated Imagery
User-submitted photos and videos can help you convert more browsers to buyers. This is especially true for categories that are highly visually in nature — such as apparel and home and garden — just to name a few.
If you’re not already, start collecting photos and videos from your shoppers. Then, display the imagery you collect in galleries on your product pages and elsewhere on your website to boost shopper confidence and conversion. Finally, be sure to measure the performance of different imagery features — and make data-based optimizations to improve performance.


It’s undisputable: shoppers who interact with user-generated content convert at higher than average levels. And certain features of UGC displays drive even larger conversion impact.
But remember: there’s not a one size fits all display that’ll work for every business. That’s why it’s critical to continuously measure the performance of your UGC displays — and then use that data to make optimizations that’ll drive an even bigger impact on conversion.
Read on for four recommendations for converting more shoppers with UGC, based on the findings of this analysis.
Prominently Display Reviews
Nearly all consumers read reviews. And there’s a 120.3% conversion lift among visitors who interact with this content. Make it easy for shoppers to find and consume the reviews that are most relevant to them. And consider adding features to your display that are proven to boost conversion, such as the ability to filter by star rating or search existing content. But don’t focus solely on creating an aesthetically pleasing display. Instead, continuously measure the performance of each feature of your display and use that data to drive impactful optimizations.
Empower Shoppers to Get Quick Answers to Purchase Blocking Questions
Q&A is the most impactful form of UGC, driving a 157.1% lift in conversion. So enable your shoppers to read the answers to questions that have already been asked — and submit their own questions too. Consider adding features to your Q&A display that have positively impacted conversion rates for other businesses. Then, measure the performance of these features on your own conversion rate, and use the data to further optimize your display and drive more sales.
Showcase Visual Content from Your Shoppers
88% of shoppers seek out photos and videos from others like them before making a purchase. And there’s an 91.4% lift in conversion when visitors interact with user-generated imagery on a product page. Ask shoppers to share photos and videos of your products in action. Then, feature this content on your product pages where it’s easy for shoppers to find and consume and elsewhere on your site. Measure the performance of your display, and follow the data to make changes that’ll impact conversion.
Become Data-Led and Conversion-First
Remember: there’s no one UGC display that’ll work well for all businesses. In fact, features that drive conversion for one brand may have little to no impact for another. That’s why it’s critical to continuously measure the performance of your UGC program. Your UGC partner should make it easy for you to see which display components are driving conversion — and which are falling flat. And then you can use that data to make changes to your display that’ll yield even better results.
