Ecommerce is quickly becoming one of the biggest markets in the world and the amount of online shopping statistics show us why. Traditional in-store shopping is still a pillar for brands like health and beauty, which rely on consumers to physically inspect and try out products before buying.
However, the overall market changes for brands selling online have morphed. Brands are more efficient at targeting core audiences and getting products in customers’ hands faster.
But how else is the marketing shifting when it comes to online shopping? What are the biggest and newest challenges for online retailers today? What opportunities are on the horizon?
To paint a better picture of the market, we’ve broken down 41 online shopping statistics for 2019 that we think you need to bookmark:
Click on the jump links to skip ahead.
- The State of Ecommerce Statistics
- Mobile Shopping Statistics
- Email, Social & Ads Statistics
- Influencer Marketing Statistics
- Conversion Rate Statistics
- Online Customer Behavior Statistics
- Ratings & Reviews Statistics
- Returns & Cart Abandonment Statistics
The State of Ecommerce Statistics
- In 2018, online sales worldwide hit an estimated $2.48 trillion, making up 8.8% of total retail sales. That means online sales have almost doubled in value since 2015. (Invespcro)
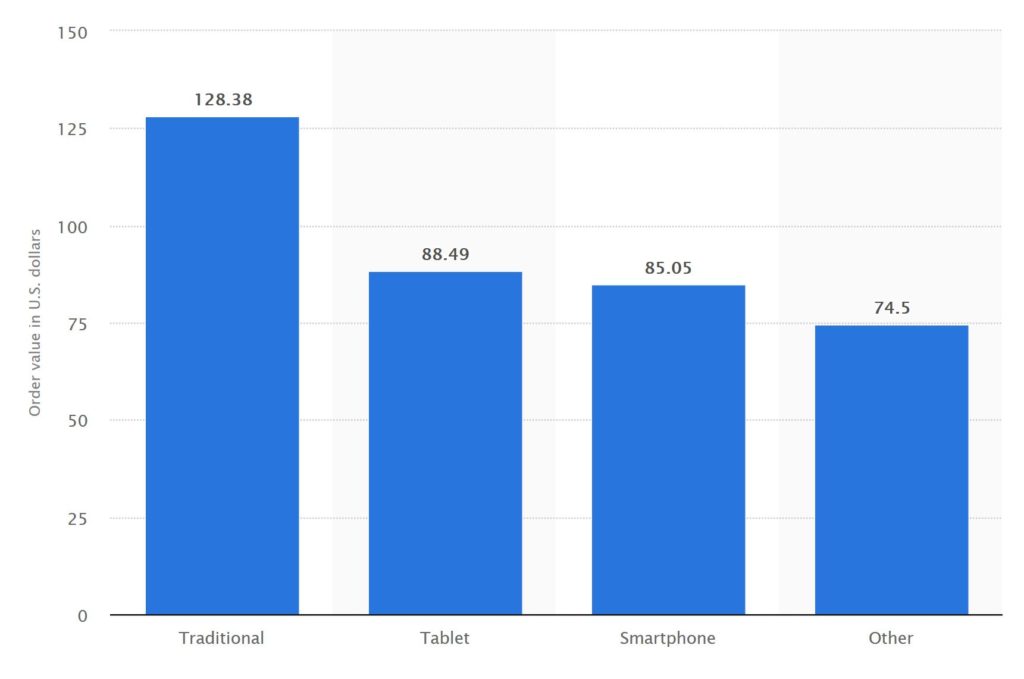
- The average value of online shopping orders in the U.S. is $128.38 on traditional devices, such as a desktop, and $85.05 on smartphones. (Statistica)
- The primary reason (43%) U.S. internet shoppers make a purchase online is for convenience. The second-most popular reason was pricing (19%). (Statistica)
- 64% of people make impulsive purchases online at least once a month. (Finder)
The Lesson
It’s no shock that ecommerce sales are on the rise. The world of online shopping is primed to continue its growth and across all devices.
People love shopping online because it’s convenient. This is a lesson to you: if your online store is going to succeed, the shopping experience needs to be as convenient as possible for your customers. That means including perks like free shipping and easy checkouts.
Mobile Shopping Statistics
- 90% of shoppers use their mobile device to help make purchase decisions while in store. (The Retail Revolution Report, PowerReviews)
- Of all mobile shoppers, 77% say they are more likely to purchase a product if the mobile website or app has product reviews. (The Growing Power of Reviews, PowerReviews)
- Mobile devices are used for 24% of all online spending. (Statistica)
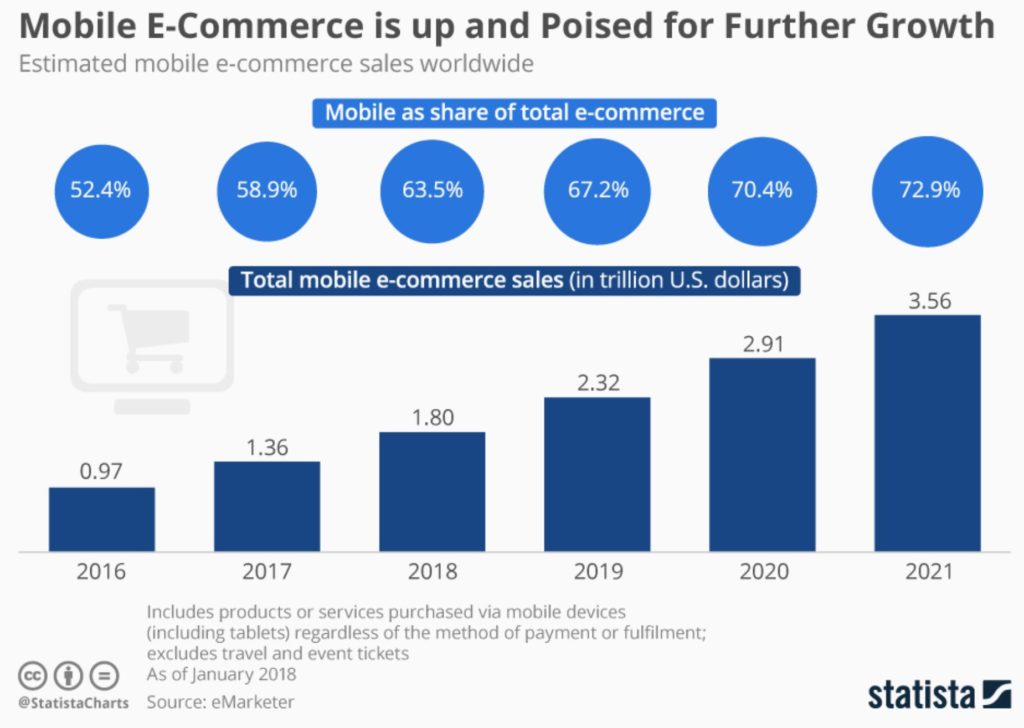
- By 2021, mobile ecommerce is projected to make up 72.9% of total ecommerce sales. (Statistica)
The Lesson
The point for your ecommerce business is to make sure your website is 100% prepared for mobile. With more shoppers coming in on tablets and smartphones, you’ll need to do various tests to ensure your whole website is just as responsive on a mobile device as it is on a desktop.
Create an easy path to purchase with faster mobile checkouts, easy log ins and adjustable high-quality visuals of your products.
Email, Social & Ads for Ecommerce Statistics
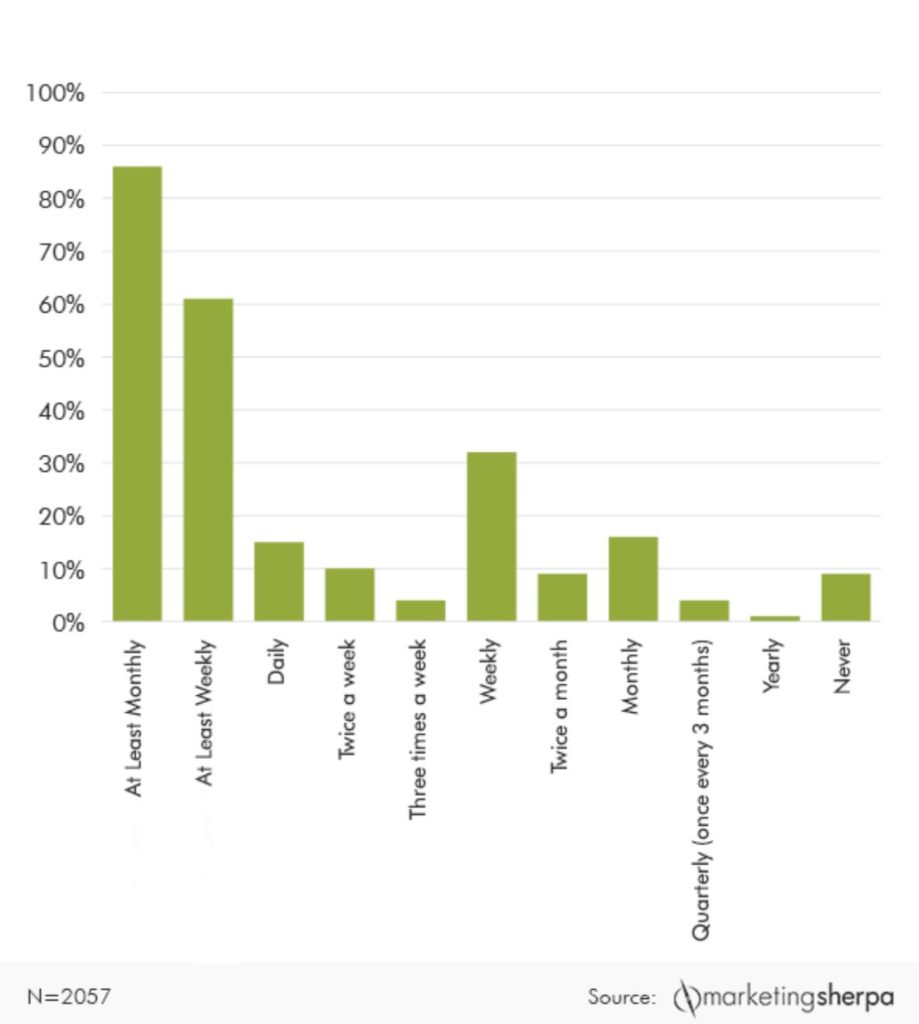
- 86% of shoppers want to get promo emails every month, while 61% want to see these emails every week. However, 15% of shoppers want promo emails every day. (Marketing Sherpa)
- When online shoppers are retargeted with display ads, they’re 70% more likely to convert. (Spiralytics)
- When customers have a positive experience with a brand on social media, 70% are likely to recommend that brand to others. (Ambassador)
- 55% of people say they made an online purchase after discovering a product on social media. (Axios)
- 80% of Instagram users admit to following at least one business (or even a few). (Instagram)
- Approximately a third of the most popular and watched Instagram Stories come from business accounts. (Instagram)
The Lesson
Email, social and paid ads should be at the top of the list for every ecommerce marketer in 2019.
Shoppers are interested in seeing promotional emails in their inbox, so make sure the content stands out. To get the right frequency, ask consumers how often they want to receive promotional emails and segment your email list accordingly.
Social is just as important for promotion as it is for customer service. So, get active where your audience is and respond to both positive and negative feedback.
Finally, use retargeting ads to get shoppers back to your website when they’ve been browsing without purchasing, or even when they abandoned their shopping cart.
Influencer Marketing Statistics
- Sponsored posts on Instagram got a total of 1 billion likes in 2017. (Emarketer)
- 84% of micro-influencers charge only $250 per sponsored post. (Bloglovin)
- Brands make an average of $6.50 for every $1 they spend on influencer marketing. (Tomoson)
- 51% of brands that use influencer marketing get higher quality customers as a result. (Tomoson)
- 54% of shoppers between ages 18-29 think photos and videos from fellow consumers are more valuable than brand or retailer visuals. That number only drops to 50% for those between ages 30-44. (Snapshot for Ecommerce, PowerReviews)
- 65% of shoppers trust products more when user-generated content, like photos and videos, are in reviews. (Snapshot for Ecommerce, PowerReviews)
The Lesson
Influencers are everywhere. And whether they have a million followers or just a thousand, they can be extremely useful to your brand.
This is a marketing opportunity you can’t pass up. And the best part is that it doesn’t have to chew up a lot of your budget. PowerReviews offers affordable product sampling campaigns you can run to promote a new product launch or get more reviews on a low-rated product.

Of course, the ROI speaks for itself–influencer marketing has the opportunity to get you more than 6 times your money back. These strategies are relatively simple to implement and see results.
Conversion Rate Statistics
- The average conversion rate of online shoppers in the U.S. during 2018 was 2.58%. (Statistica)
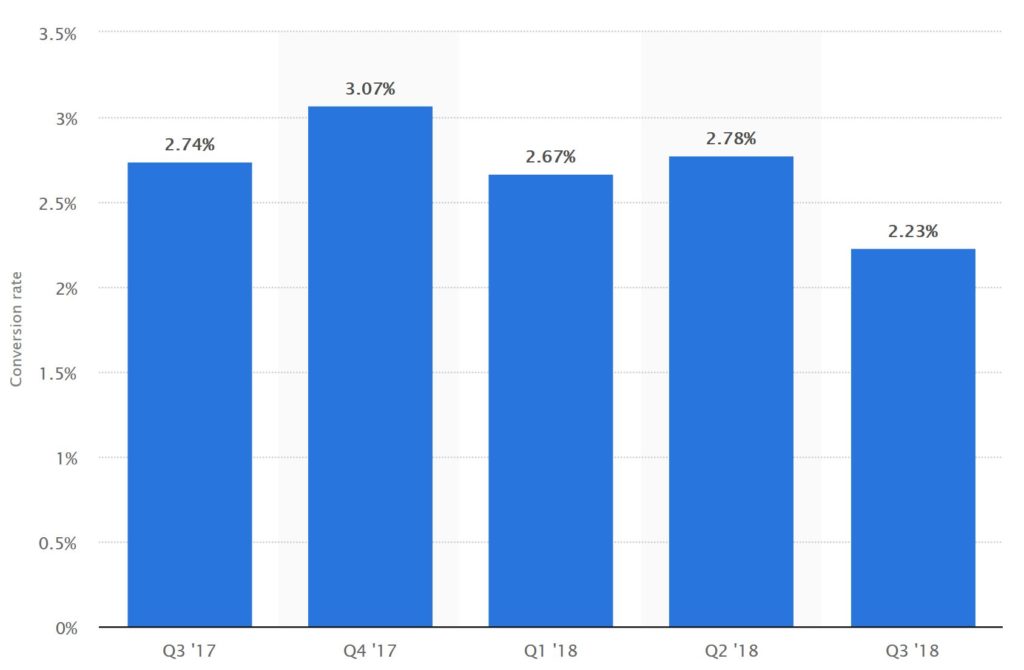
- Ecommerce stores that use video on product pages saw a 134% boost in conversion. (Crazy Egg)
- A delay of just 1 second in page response can result in a 7% decrease in conversion rates. (Kissmetrics)
- On average, apparel products sold on the PowerReviews Open Network see a 14.48% increase in conversion rate once the items start generating ratings and reviews. (Importance of Reviews for Apparel, PowerReviews)
- Products with reviews see a 270% increase in conversion. (From Reviews to Revenue, PowerReviews & Northwestern University)
The Lesson
Looking at the benchmark, how does your ecommerce store match up?
How your website works plays a huge part in your conversion rate. If you’re looking to improve your conversion rates, try adding video content to product pages. If it’s user-generated content, even better!
Also, make sure that your page speed and response time is optimized. This will help reduce your bounce rate and increase conversions.
Online Customer Behavior Statistics
- 32% of customers are more likely to buy clothing online if a website features photos of real customers wearing the item. (Olapic)
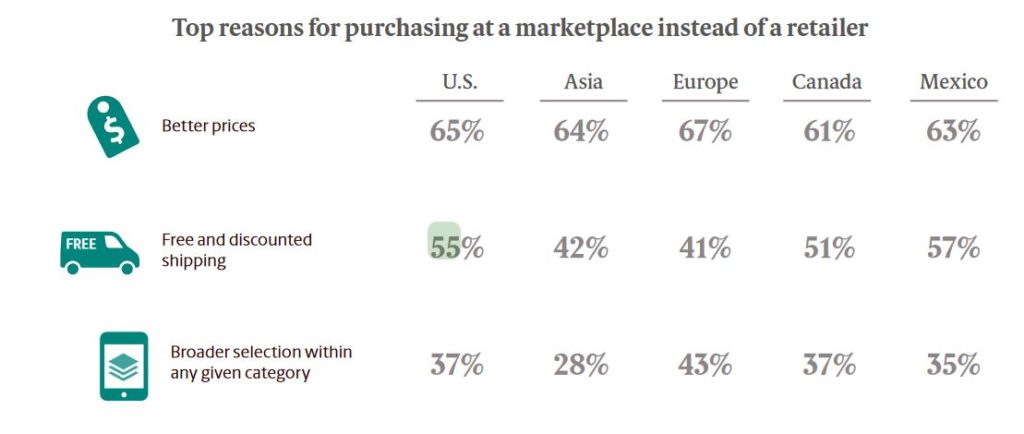
- Of the U.S. consumers shopping through online marketplaces, 55% say the most important checkout option is free shipping. (UPS)
- Just 3% of shoppers say they never rely on visuals when purchasing online. (Snapshot for Ecommerce, PowerReviews)
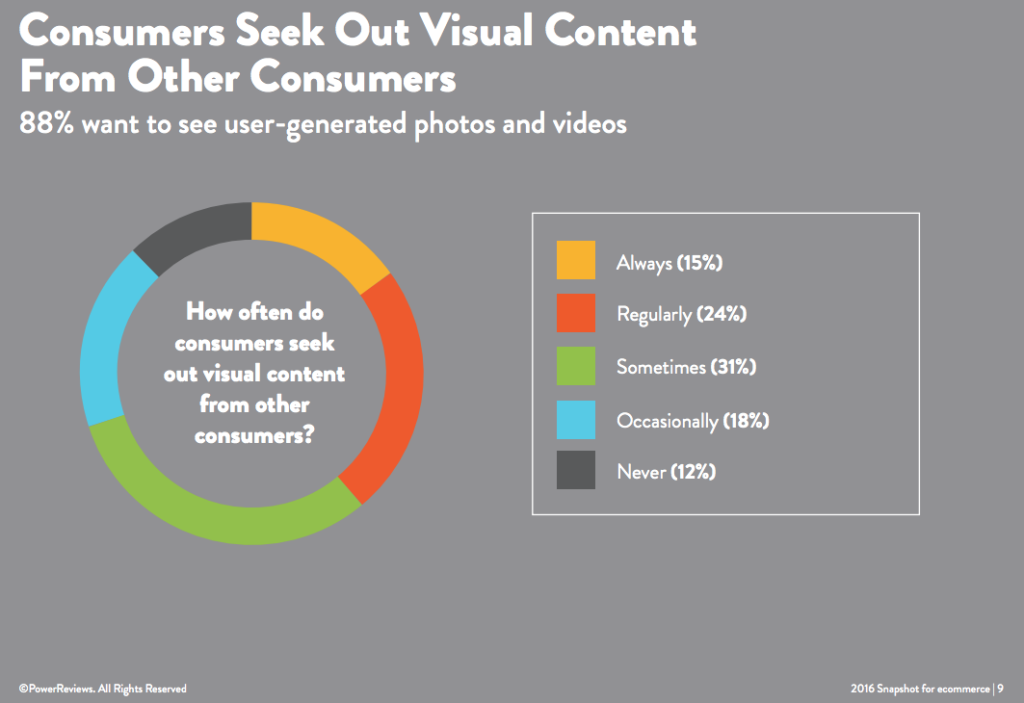
- On the other hand, 88% of online shoppers specifically look for user-generated content, like pictures or videos, before buying. (Snapshot for Ecommerce, PowerReviews)
- The ideal average star rating for purchase probability is 4.2-4.5 stars. Perfect 5-star reviews are considered too good to be true. (From Reviews to Revenue, PowerReviews & Northwestern University)
- 79% of shoppers say they are less likely to buy from a seller if their site is dissatisfactory or has poor performance. (Kissmetrics)
The Lesson
Basically, people want authenticity. By creating transparency into your products, whether it’s through ratings and reviews or website performance, consumers want trust before buying.
Allowing easy access to product photos and videos will build even more authenticity in your product. It’s essential to add this visual content to your product pages and allow potential customers to see how real people enjoy your products.
Ratings and Reviews Statistics
- 70% of consumers are interested in accessing product ratings and reviews in store. (The Retail Revolution Report, PowerReviews)
- 45% of consumers are more likely to come back to a brand that responds to their negative review. (ReviewTrackers)
![]()
- 85% of shoppers specifically look for negative reviews while researching a product. For shoppers between 18 and 29, this number jumps to 91%. (The Growing Power of Reviews, PowerReviews)
- 44% of centennial shoppers lose trust in a product when there are no negative reviews. (Understanding the Centennial Shopper, PowerReviews)
- 66% of shoppers who go to a brand website specifically look for product information to research or verify their buying decision. (Forrester)
- Of the shoppers saying they don’t write reviews, 55% said they need an incentive or reward to do so. (The Growing Power of Reviews, PowerReviews)
The Lesson
Again–transparency is key.
Not only do people look for positive review content, they want to see negative reviews as well. Brands need to display both sides of the story to create more transparency into your products.
Display your product reviews clearly. Make the content easy to access, whether users are on a desktop or mobile device.
Returns & Cart Abandonment Statistics
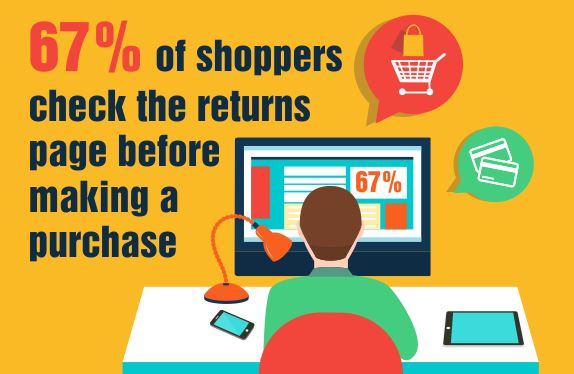
- 67% of shoppers check the returns page before making a purchase, and 79% want free return shipping. (Invespcro)
- While 72% of customers will abandon their shopping cart, only 8% will come back and finish their purchase. (Wishpond)
- 22% of people who abandon their carts do so because of surprise costs that only showed up while they were checking out. (SmallBizTrends)
- 92% of online shoppers will buy something again if product returns are easy. (Invespcro)
The Lesson
Making it easy to return your products may seem counterintuitive. However, doing so has obvious benefits for your business.
Not only will people be more likely to purchase, but those who do return often purchase something else. Ecommerce returns may be for something as simple as a sizing problem or a product being damaged in transit.
Additionally, abandoned carts should avoid hidden costs until the end. Be transparent about how much a product will cost from the get-go. Try to avoid posting taxes or shipping costs at the end of the checkout experience.
Online Shopping Keeps Growing: Are You Growing With It?
As we’ve seen from the online shopping statistics for 2019, the market is growing and the demands from consumers are too. If you’re using the right tactics, your ecommerce brand will continue to be ready for the various changes in the industry.
Use the statistics above to improve your ecommerce business and share your favorite stats with us on Twitter!


