Raising the Bar for UGC
Aggregate standards and breakdowns by industry.
- All
- Brand Health Index
- Category Scorecard
- UGC Benchmarks
- All
- Brand Health Index
- Category Scorecard
- UGC Benchmarks
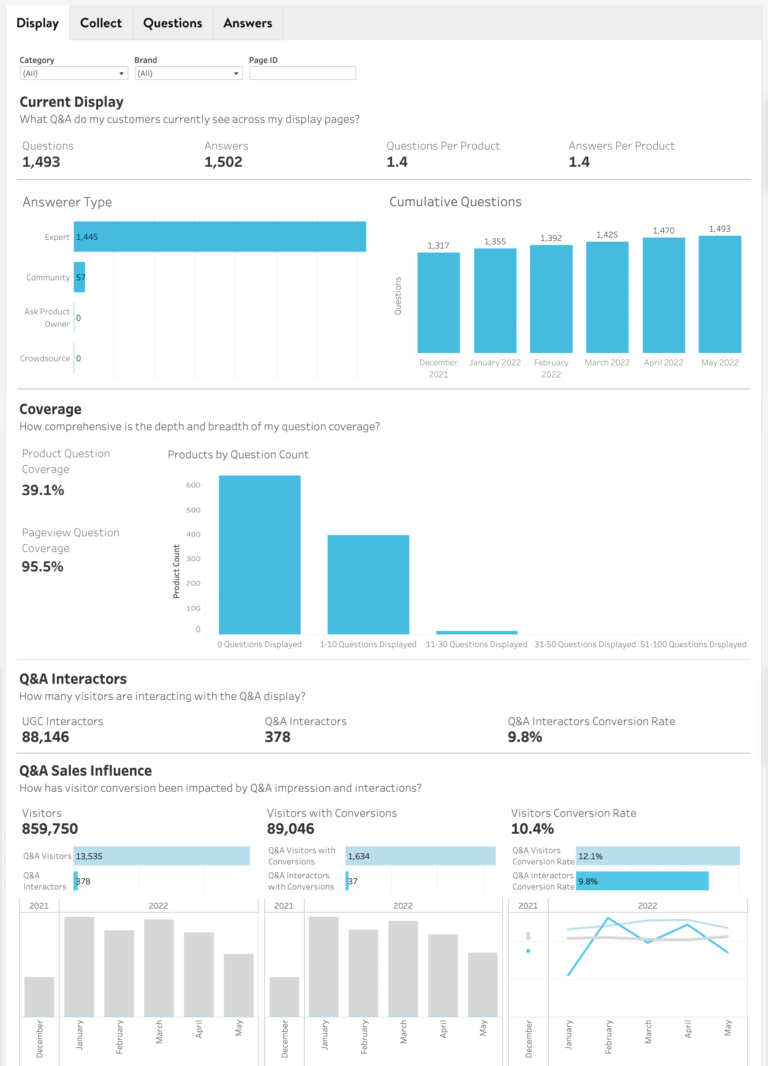
Q&A: Av. Interactor and Impression Conversion Lift
A Q&A Impression Lifts Conversion by 51%, While a Q&A Interaction Lift Conversion 138%
Ratings & Reviews: Av. Interactor and Impression Conversion Lift
Simply Seeing Reviews Lifts Conversion by 20%, While Interacting With Reviews Lifts Conversion by 128%
Ratings & Reviews Benchmarks: Visual UGC
Despite Increasing Importance to Consumers, Average Media Coverage for Most Brands Hovers Around 37%
Ratings & Reviews Benchmarks: Review Length
The Average Review Is Only 218 Characters Long, Far Below the Consumer-Preferred 500+ Minimum
Ratings & Reviews Benchmarks: Review Volume
The Average Product Boasts 402 Reviews, But This Is Still Lower Than Consumer Expectations
Ratings & Reviews Benchmarks: Average Av. Rating
Across Verticals, Average eCommerce Product Rating is 4.5 Stars
Ratings & Reviews Benchmarks: Average Rating Impact on Conversion
The Sweet Spot for conversion is 4.75-4.99 stars
2022 Brand Health Index: Coffee & Cereal Edition
Breakfast Brands ranked based on Ratings & Reviews captured across key retailers and marketplaces
Brand Health Index: Bath & Body Edition 2021
Beauty Brands ranked based on Ratings & Reviews captured across key retailers and marketplaces


