Key Findings:
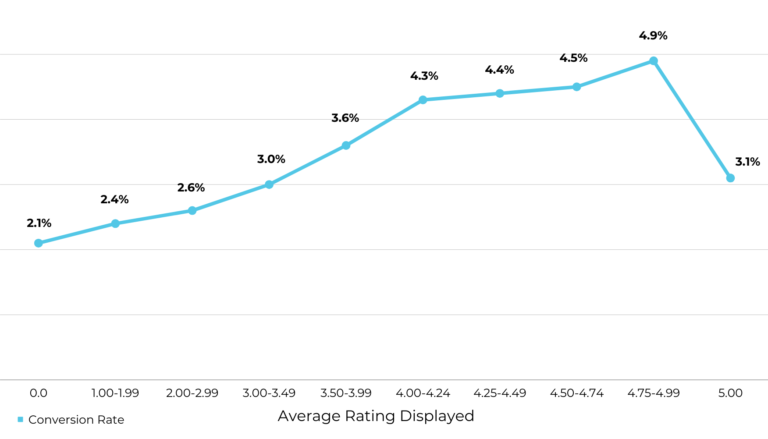
- 4.75 – 4.99 stars is the optimal product rating for conversion. Products in this band have – on average – the highest conversion rates.
- The biggest leap in conversion – in percentage terms – between bands is from 3 – 3.49 stars to 3.5 – 3.99 stars (20%), closely followed by 3.5 – 3.99 to 4.0 – 4.24 stars (19%).
- A 4 star average rating is where the conversion rate rises above 4%, with overall highest conversion rates in the 4.25 – 4.99 range.
- Products with average ratings of 5 stars have comparable conversion rates to products with 3.0 – 3.49 stars.

The takeaway here for ecommerce practitioners wondering what targets they should set themselves: anything above 4 stars is good, 4.25 stars better, 4.5 stars better still and 4.75 stars the “North Star” goal.
All the while, you need to underpin any targets you do set yourself with the context of the specifics of your own business (e.g. vertical you operate in and competitors you’re up against, pricepoint of your product, etc). Ultimately, consumer expectations – which are a big part of how shoppers approach submitting ratings and reviews – are dictated by a number of factors that are likely unique to your business.
These results make one thing completely clear: consumers pay attention to the average rating. That might sound obvious in and of itself but remember star ratings are rounded to the nearest half star – in other words, both a 4.75 average rating and a 5.0 average rating will appear as a 5 star on a product page. There is a significant difference between the conversion rates in both of these bands. This means that shoppers clearly look beyond the star visual when deciding whether to purchase a product.
One finding – again – is clear and unmistakable. Consumers don’t trust 5-star average ratings. This supports much of our research: we have found a sizable proportion of consumers are suspicious of perfect 5-star ratings, including 46% of shoppers overall and 53% of Gen Z shoppers.
Five Snackable Data-Backed Average Rating Tips
- Continually collect ratings and reviews: A Ratings and Reviews program needs constant work (consumers value review recency more than total volume nowadays). A continual focus on collection – in the right way – will also increase your average rating or, if you’re in a good spot already, maintain an existing high rating. We have loads of tips on collecting more review content in our Complete Guide.
- Prominently display the average rating AND rating breakdown on product detail pages: Consumers look beyond the star rating visual (99% say they do so at least sometimes), which indicates they are thirsty for deeper information. So make sure you give them it. Highlighting the average rating is a good start but also enables them to see how many shoppers rated the product 5, 4, 3, 2, or 1 stars. This allows shoppers to filter for reviews of a certain star rating (shoppers who click on these filters convert at 111.8% the rate of those who visit the same page and do not).
- Embrace negative reviews: The general population has become increasingly suspicious of what they see online in recent years. This has been clear in how shoppers approach Ratings and Reviews, where so-called “fake reviews” have been a big concern. While not manufacturing or faking review content is an obvious first step to fostering authenticity, also embrace negative reviews. 62.4% of shoppers actively seek out one-star reviews by clicking on these star breakdowns — and they still convert at a rate that’s 108.8% higher than those who don’t interact with review content.
- Analyze quantitatively and qualitatively: Your review content contains a goldmine of likely untapped product experience feedback. For products you want to improve average ratings, identify some common themes why, and then dig into individual review comments for the specific context. This will provide clear and actionable guidance on how to make improvements.
- Build good products and manage consumer expectations: Maybe obvious, but weak products generate poor reviews. Something else that creates poor reviews: unrealistic expectations around how the product will perform. Performance in both these areas will be evident if you analyze your review content (as per recommendation 4). Make sure the messaging on your product pages and throughout your site is accurate and isn’t going to set you up for failure. When asked what motivates them to write a review, 91% of consumers responded with “a positive experience,” while 76% said “a negative experience.”


