Key Findings:
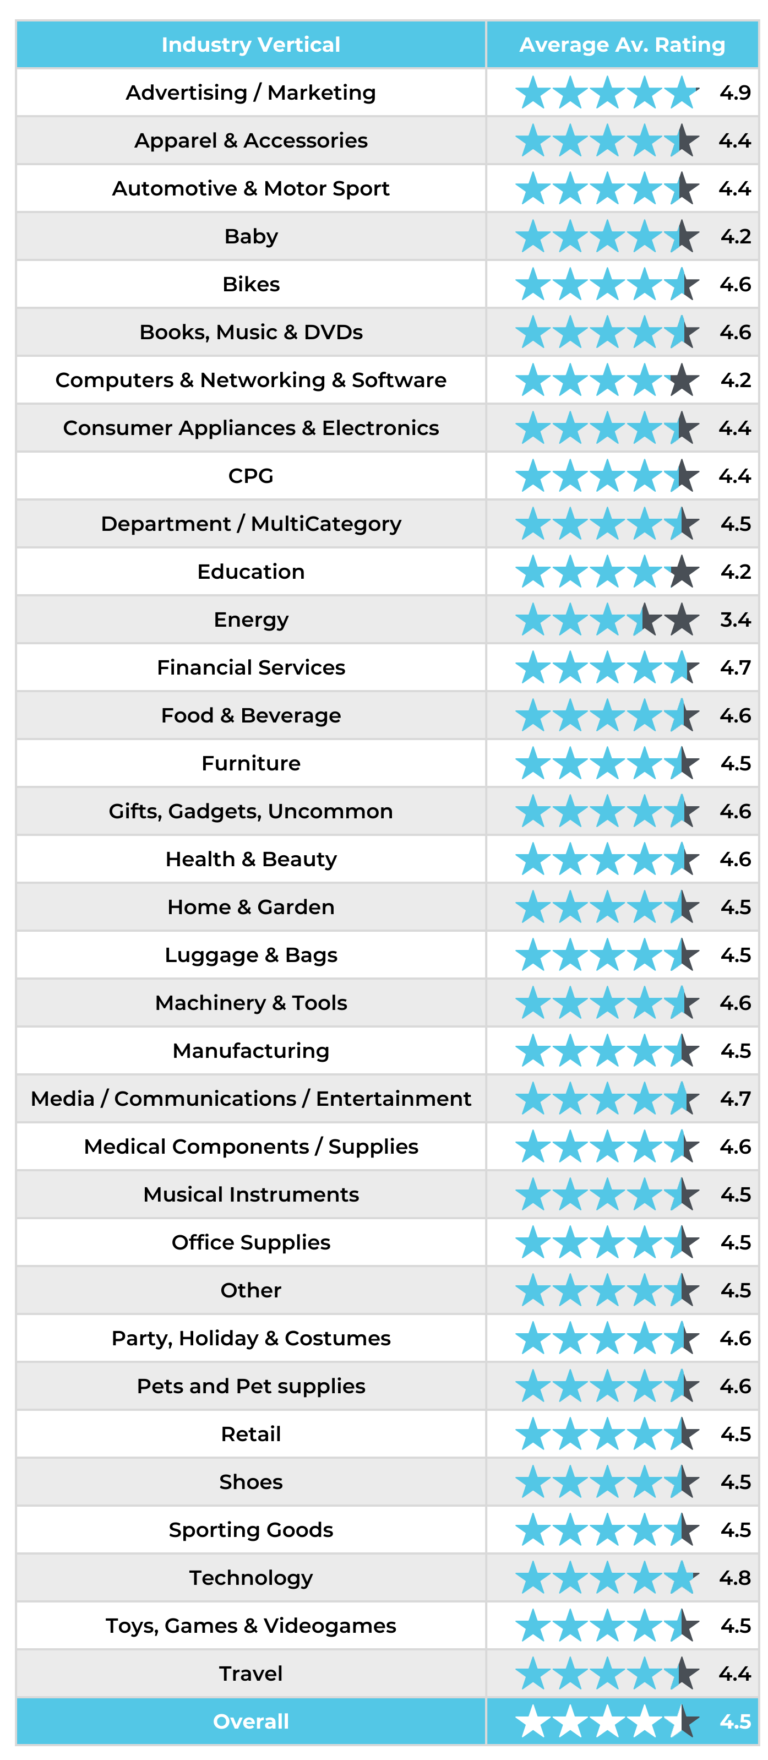
- Across verticals, our data shows that the average rating for any given product is 4.5 stars out of 5.
- The verticals with the highest star ratings included Advertising / Marketing (4.9 stars), Technology (4.8 stars), and Financial Services and Media / Communications / Entertainment, both at 4.7 stars.
- The verticals with the lowest ratings included Energy (3.4 stars), and Baby, Education, and Computers & Networking & Software, all at 4.2 stars.

Across verticals, our data shows that the average rating for any given product is 4.5 stars out of 5. This is actually the exact star rating we recommend brands aim for, as a sizable number of consumers are suspicious of perfect 5-star ratings, including 46% of shoppers overall and 53% of Gen Z shoppers.
Even the vertical with the highest star rating — Advertising/Marketing — has a 4.9 rating as opposed to a 5. The verticals with the next highest ratings include Technology, at 4.8 stars, and Financial Services and Media / Communications / Entertainment, both at 4.7 stars.
Previous research we conducted with Northwestern University found that shoppers are most likely to purchase products with an average star rating between 4.2 and 4.5 stars. Our latest benchmarks indicate that the sweet spot has risen slightly since but we continue to see the highest conversion rates in the 4.25 – 4.99 average rating range. Positively, only one vertical — Energy — fell beneath this baseline star rating, with 3.4 stars out of 5.
Ratings and reviews are the single most important factor impacting purchase decisions, ranking above price, free shipping, brand, and recommendations from family and friends. 97% of consumers read ratings and reviews prior to making a purchase. Among them, the star rating is the first thing shoppers notice, with 77% considering the average rating of a product when reading reviews.
Five Snackable Data-Backed Average Rating Tips
- Regularly solicit feedback and new reviews: Be willing to ask for reviews more than once. One in three people need to be asked two or three times before they leave a review. Follow up at least two times, and 96% of consumers say they will write a review.
- Prominently display star ratings on product detail pages: Include a breakdown of the overall star ratings, so people can see how many shoppers rated 5, 4, 3, 2, or 1 stars. This allows shoppers to click on any of the bars to see only reviews of a certain star rating. Shoppers who click on these filters convert at 111.8% the rate of those who visit the same page and do not.
- Don’t be afraid of negative reviews: 62.4% of shoppers actively seek out one-star reviews by clicking on these star breakdowns — and they still convert at a rate that’s 108.8% higher than average. Negative reviews are an important tool shoppers depend on to make informed purchase decisions. One-star reviews can actually help shoppers confirm a product is right for them, if the one-star reviewer had a different use case or pain point. Negative reviews can also help brands reduce returns. 70% of consumers say they would have been less likely to return a product they purchased online if they had consulted the ratings and reviews first.
- Read and respond to reviews: Listen to the feedback provided by your customers, and use it to inform new features and product redesigns. When relaunching a new and improved product, share free samples to generate new reviews quickly. Between 85% to 91% of consumers say receiving a product free of charge, or before it’s sold to the general public, would incentivize them to write a review.
- Focus on experience: Providing a positive customer experience should always be a brand’s first priority, as that will naturally drive positive ratings and reviews. When asked what motivates them to write a review, 91% of consumers responded with “a positive experience,” while 76% who responded “a negative experience.”
More Benchmarks
UGC Benchmarks: Review Influence on Online Traffic to Product Pages
More Reviews and Stronger Average Ratings Increase Product Page Visits
Visual UGC Benchmarks: Av. Interactor and Impression Conversion Lift
Modest conversion lift for Visual UGC impressions; but Visual UGC Interactions more than double conversion
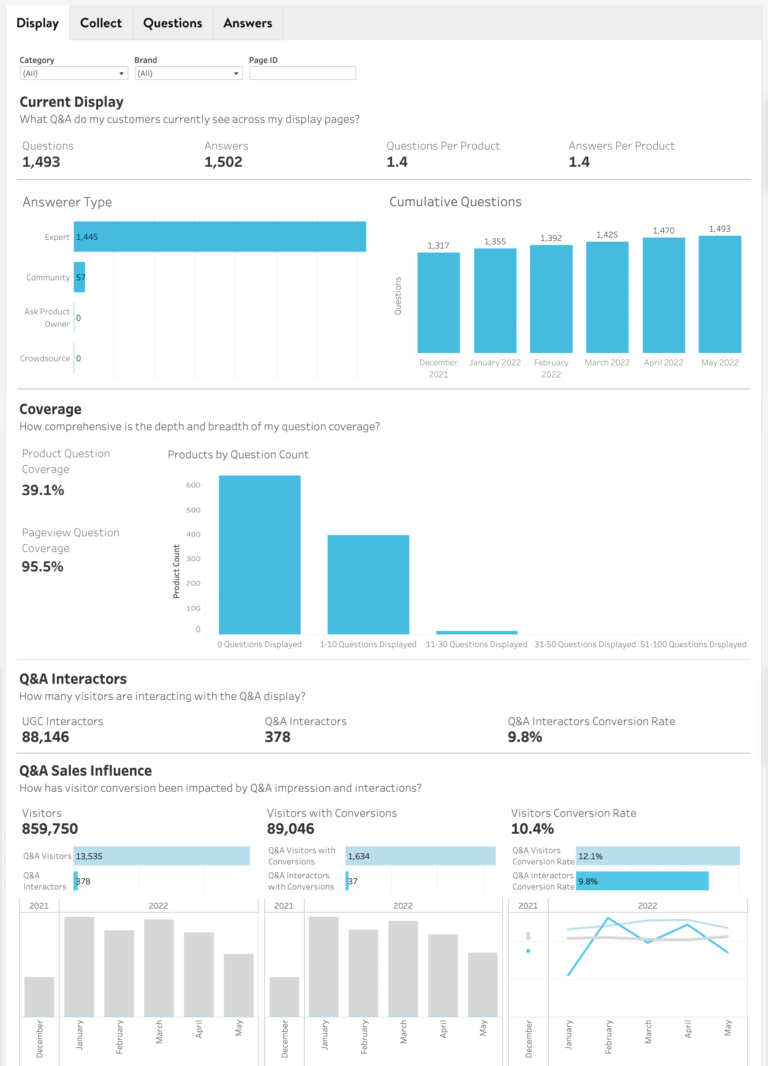
Q&A: Av. Interactor and Impression Conversion Lift
A Q&A Impression Lifts Conversion by 51%, While a Q&A Interaction Lift Conversion 138%
Ratings & Reviews: Av. Interactor and Impression Conversion Lift
Simply Seeing Reviews Lifts Conversion by 20%, While Interacting With Reviews Lifts Conversion by 128%


