Key Findings:
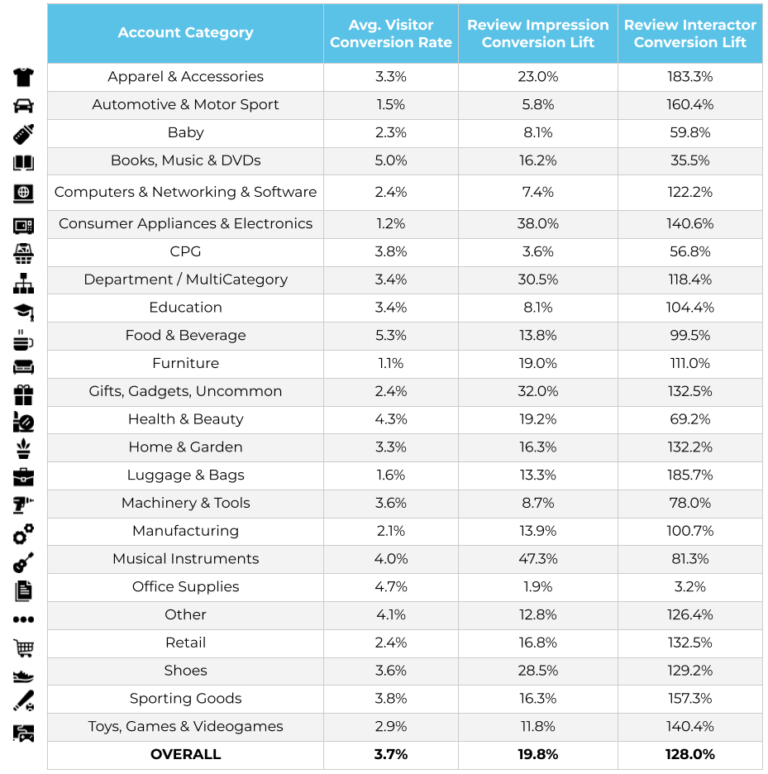
- Across verticals, the conversion lift for visitors who are served review content was 19.8%, showing that the mere presence of reviews can positively impact conversion.
- When visitors interact with review content, however, the impact is much higher. Interacting with reviews leads to a 128.0% conversion lift, on average, across verticals.
- The verticals with the highest review visitor conversion lift were Musical Instruments; Consumer Appliances & Electronics; and Gifts, Gadgets, & Uncommon Products.
- The verticals with the highest review interactor conversion lift include Luggage & Bags; Apparel & Accessories; and Automotive & Motor Sport.

Ratings and reviews have become the most important factor impacting purchase decisions, ranking above price, free shipping, brand and recommendations from family and friends. In fact, reviews influence a shopper’s decision to convert to such an extent that those who interact with ratings and reviews convert at a rate that’s 108.3% higher – according to our analysis throughout 2021.
Given the high conversion impact of ratings and reviews, we sought out to analyze the conversion impact across different verticals. In our analysis, we looked at both the conversion lift by visitor (those who saw review content on the product page they visited) and review interactor (those who interacted with review content on the page they visited). We’ve also shared the average conversion rate for each vertical as a baseline.
The verticals with the highest visitor conversion lift were Musical Instruments (+47.3%), Consumer Appliances & Electronics (+38.0%), and Gifts, Gadgets, & Uncommon Products (+32.0%). Interestingly, these all differ from the product verticals that enjoyed the highest conversion lift from review interactors, which include Luggage & Bags (+185.7%), Apparel & Accessories (+183.3%), and Automotive & Motor Sport (+160.4%).
Across verticals, the conversion lift for visitors who encountered review content was 19.8%, showing that the mere presence of reviews can positively impact conversion. When visitors interact with review content, however, the impact is much higher. The average conversion lift for review interactors was 128.0% across verticals (higher than the previously mentioned number for 2021).
Five Snackable Data-Backed Review Display Tips
- Make your review display pop. Use your brand’s brightest, most clickable color to show off your review stars, and ensure your review display is easy to navigate and click. You want to invite engagement to enjoy that conversion lift.
- Encourage review voting. Overwhelmingly, customers who interact with the Helpful voting feature on reviews have the highest conversion rate of all review interactors. There’s a 414.3% lift in conversion among visitors who click the thumbs up icon on a review, and a 292.9% lift in conversion among visitors who click the thumbs down icon.
- Enable review search. Make it easy for shoppers to find the keywords they’re searching for with review search. Visitors who interact with the review search feature experience a 260.7% lift in conversion.
- Use pagination in your review footer. Many visitors scroll to read through at least the first full page of review content. Allow them to sit and read for a while with buttons that let them toggle back and forth between reviews, or go back to where they started. Clicking the Previous button in the review footer has a 242.9% lift in conversion, while clicking the Back to Top button has a 178.6% lift in conversion.
- Make your review snippet clickable. We call the high-level review data at the top of a product page (star rating and review count) the review snippet. When visitors click on this, they’re taken to the full review display, where they can read individual reviews, as well as sort and filter content to find what’s most relevant to them. There’s a 164.3% conversion lift among consumers who click the review snippet.
More Benchmarks
UGC Benchmarks: Review Influence on Online Traffic to Product Pages
More Reviews and Stronger Average Ratings Increase Product Page Visits
Visual UGC Benchmarks: Av. Interactor and Impression Conversion Lift
Modest conversion lift for Visual UGC impressions; but Visual UGC Interactions more than double conversion
Q&A: Av. Interactor and Impression Conversion Lift
A Q&A Impression Lifts Conversion by 51%, While a Q&A Interaction Lift Conversion 138%
Ratings & Reviews Benchmarks: Visual UGC
Despite Increasing Importance to Consumers, Average Media Coverage for Most Brands Hovers Around 37%


