Key Findings:
- Across verticals, products had 12.8 images and/or videos, on average.
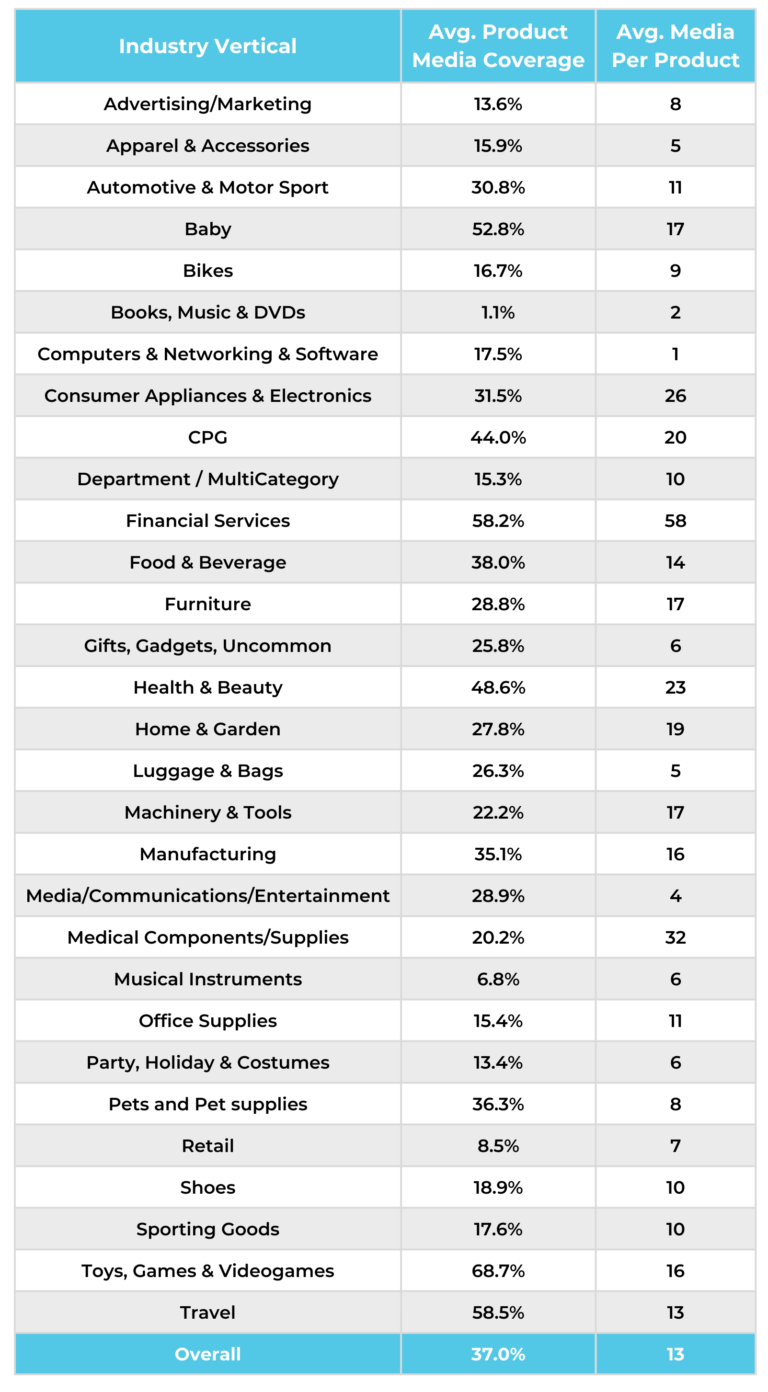
- The verticals with the most media coverage overall were Toys, Games & Video games; Travel; Financial Services*; and Baby.
- The verticals with the most media per product included Financial Services*; Medical Components/Supplies; Consumer Appliances & Electronics; and Health & Beauty.

99% of consumers look for photos and videos submitted from other customers at least sometimes; 77% do so always or regularly. Visual UGC is especially important to younger consumers, with 91% of Gen Z’ers and 84% of Millennials always or regularly seeking it out. Given the high value consumers place on visual UGC, we analyzed media coverage (percentage of products with at least one user-submitted image or video displayed) and average volume of media per product in a given vertical.
The verticals with the most media coverage overall were Toys, Games & Videogames (68.7%), Travel (58.5%), Financial Services (58.2%), and Baby (52.8%). The verticals with the highest average media per product included Financial Services (58.1), Medical Components/Supplies (31.9), Consumer Appliances & Electronics (26.3), and Health & Beauty (23.3).
Across verticals, there is an average of 12.8 images and/or video per product. The average overall media coverage was 37.0%.
From Marketing Validation to Conversion Booster: The Rise of Visual UGC
User-generated visual content has become increasingly important to consumers. Today, 80% of consumers say photos from other customers are more valuable than those provided by brands or retailers. Five years ago, only 44% felt this way.
Visual UGC is not only important to consumers; it increases their likelihood of conversion. More than half of consumers say imagery provided by previous purchasers is a top factor influencing their purchase decision. When people interact with visual UGC, the conversion rate nearly doubles from 3.4% to 6.6% (an increase of 91.4%). For some verticals, such as Apparel and Home & Garden, the conversion lift is even higher — at 119.1% and 149.9%, respectively.
By the same token, a lack of visual UGC can deter purchases. A third of Gen Z shoppers and nearly a quarter (21%) of Millennials won’t purchase a product if there is no visual content from people who previously bought it. Visual media is so important to consumers that 65% of shoppers rate images as the most valuable part of any individual review, even above the review length, title, and aggregated pros and cons lists.
Visual media has a powerful impact on conversions because it provides context beyond the typical ecommerce product photo carousel. Consumers can see how a shirt looks on the body of someone who isn’t a model, maybe even someone who has a body just like them. They can see how the color looks in different types of lighting. Visual UGC also invites shoppers to visualize using the product in real life. They can see other customers using your milk frother, styling your accessories, or building your desk furniture.
Five Snackable Data-Backed Visual UGC Collection Tips
- Incentivize shoppers to provide photo and video: A large swatch of consumers — as many as 85% — need to be incentivized to leave a review. Make it worth their while. Run a product sampling campaign, host a review sweepstakes, or make visual UGC a point-earning activity in your rewards program.
- Mine social media for visual UGC: There’s no need to reinvent the wheel. If shoppers have already posted about your products on social media, repost their content to your site, too. Using this strategy, PowerReviews customer Shure Incorporated was able to quickly collect over 1,200 images.
- Syndicate images to retailer partners: This can not only help lift conversion rates on partner websites, but can also encourage those customers who you don’t have a direct line of contact with (e.g. email) to add media content to their review. When people see others doing something, they’ll often follow in their footsteps.
- Include filters so customers can easily find images and video: Over three-quarters (77%) of shoppers find filtering options useful when browsing review content. The number is even higher among younger consumers. In addition to filters for star rating or “helpful” votes, include one for whether the review includes visual content.
- Make it easy to submit visual UGC: Be clear about what’s required for an upload to be accepted (file format, size, etc.). Ensure your review form and media upload form is mobile-friendly, so customers can upload it on the fly. Allow people to link to photos from Facebook or Instagram as well, increasing the social proof factor.
More Benchmarks
UGC Benchmarks: Review Influence on Online Traffic to Product Pages
More Reviews and Stronger Average Ratings Increase Product Page Visits
Visual UGC Benchmarks: Av. Interactor and Impression Conversion Lift
Modest conversion lift for Visual UGC impressions; but Visual UGC Interactions more than double conversion
Q&A: Av. Interactor and Impression Conversion Lift
A Q&A Impression Lifts Conversion by 51%, While a Q&A Interaction Lift Conversion 138%
Ratings & Reviews: Av. Interactor and Impression Conversion Lift
Simply Seeing Reviews Lifts Conversion by 20%, While Interacting With Reviews Lifts Conversion by 128%


