This is the post-Holiday special edition of our monthly snapshot, an analysis of consumer activity on the weekend from Thanksgiving thru Cyber Monday across more than 1.5MM online product pages from more than 1,200 retail/brand sites. This is old news but worth reiterating due to knock-on Holiday impact: the effect of Covid on ecommerce activity has been immense.
To recap, a huge initial surge led to an overall 3x increase in online purchase volumes between February (pre-pandemic) to May. However, the subsequent four months through to October led to a steady decline and then stabilization, with purchase volumes consistently between 40% and 70% higher than they were pre-pandemic (we actually re-aligned our reports to three month periods due to this stabilization).
We then saw a slight uptick in preparation for the Holidays (remember: shopping was expected to start early this year).
Then onto the Holidays. No one really knew what to expect given the unique conditions created by the pandemic.
Last month, we commented how our data at that point showed a bigger increase in 2020 than 2019 (of course coming off a bigger baseline in 2020). However, this proved premature.
Read on to find out more.
Key ecommerce market trends
01
02
03
Traffic and sales surge over Holiday weekend
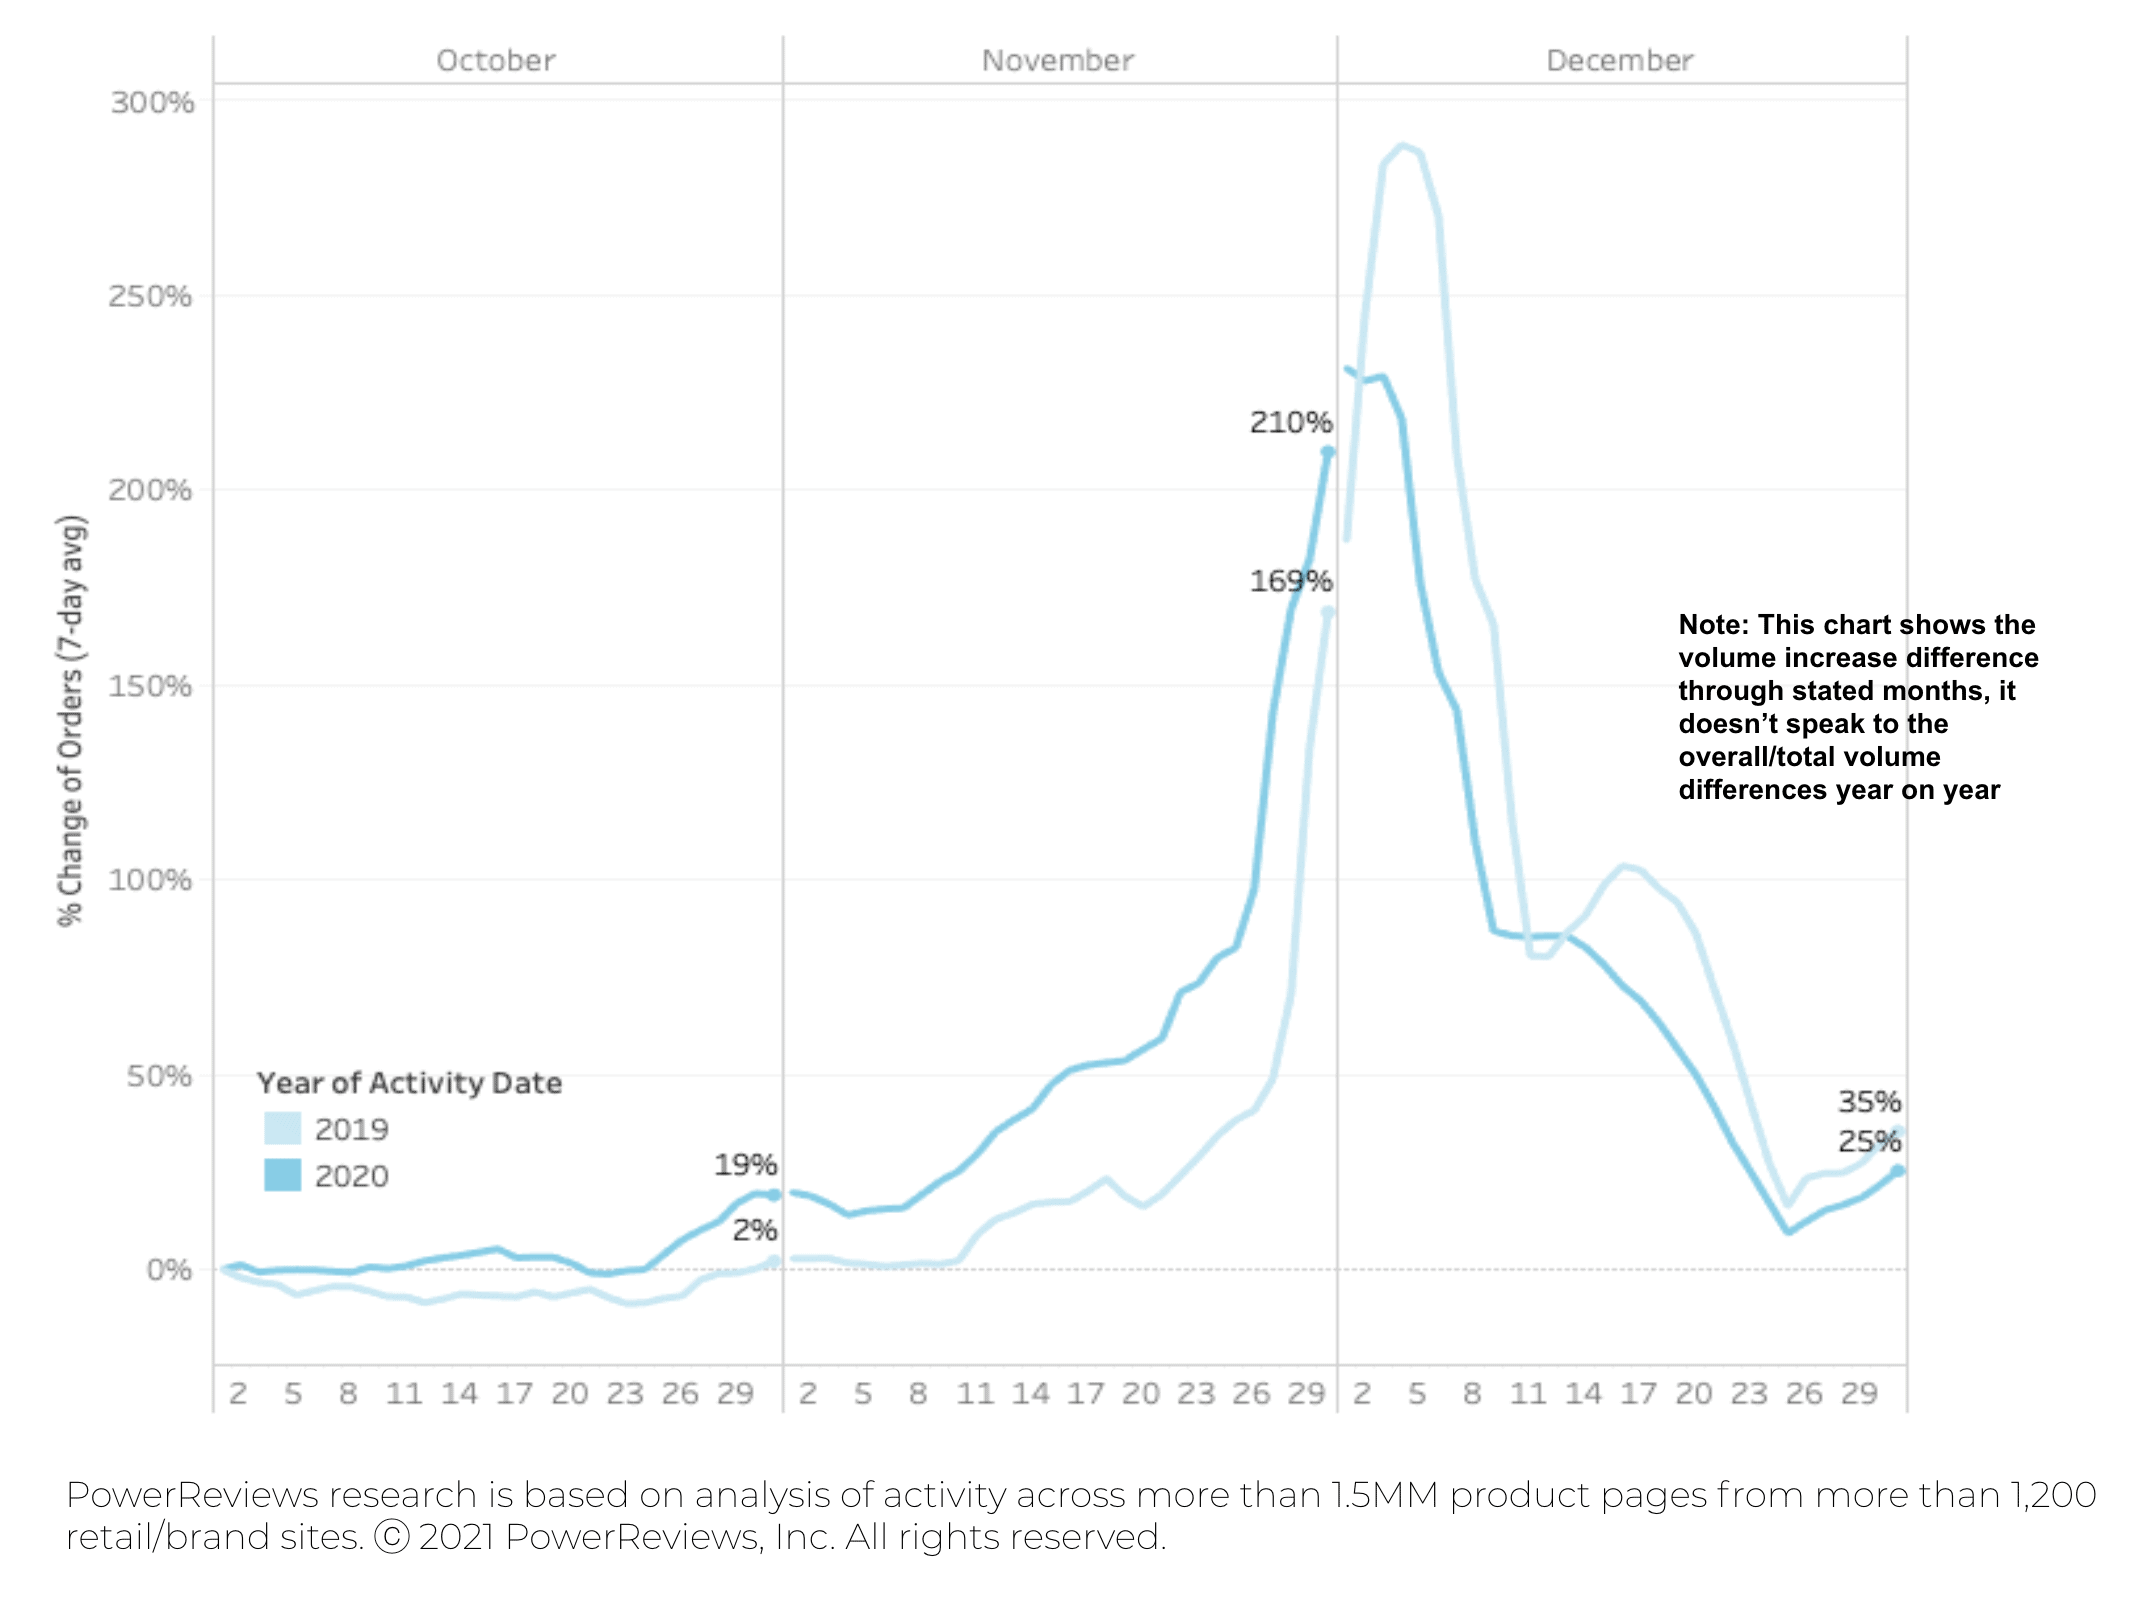
Prior to the Holidays, consumer behavior had clearly become more predictable, with purchase volumes consistently around 1.4x to 1.7x where they were at the start of the pandemic (this was after a giant surge in April, May and June). So remember that is the baseline we’re dealing with in the chart below.
But the Holidays brought us into uncharted territory. Typically, we can predict online shopping volumes will increase, but this Holiday period is completely unprecedented for obvious reasons.
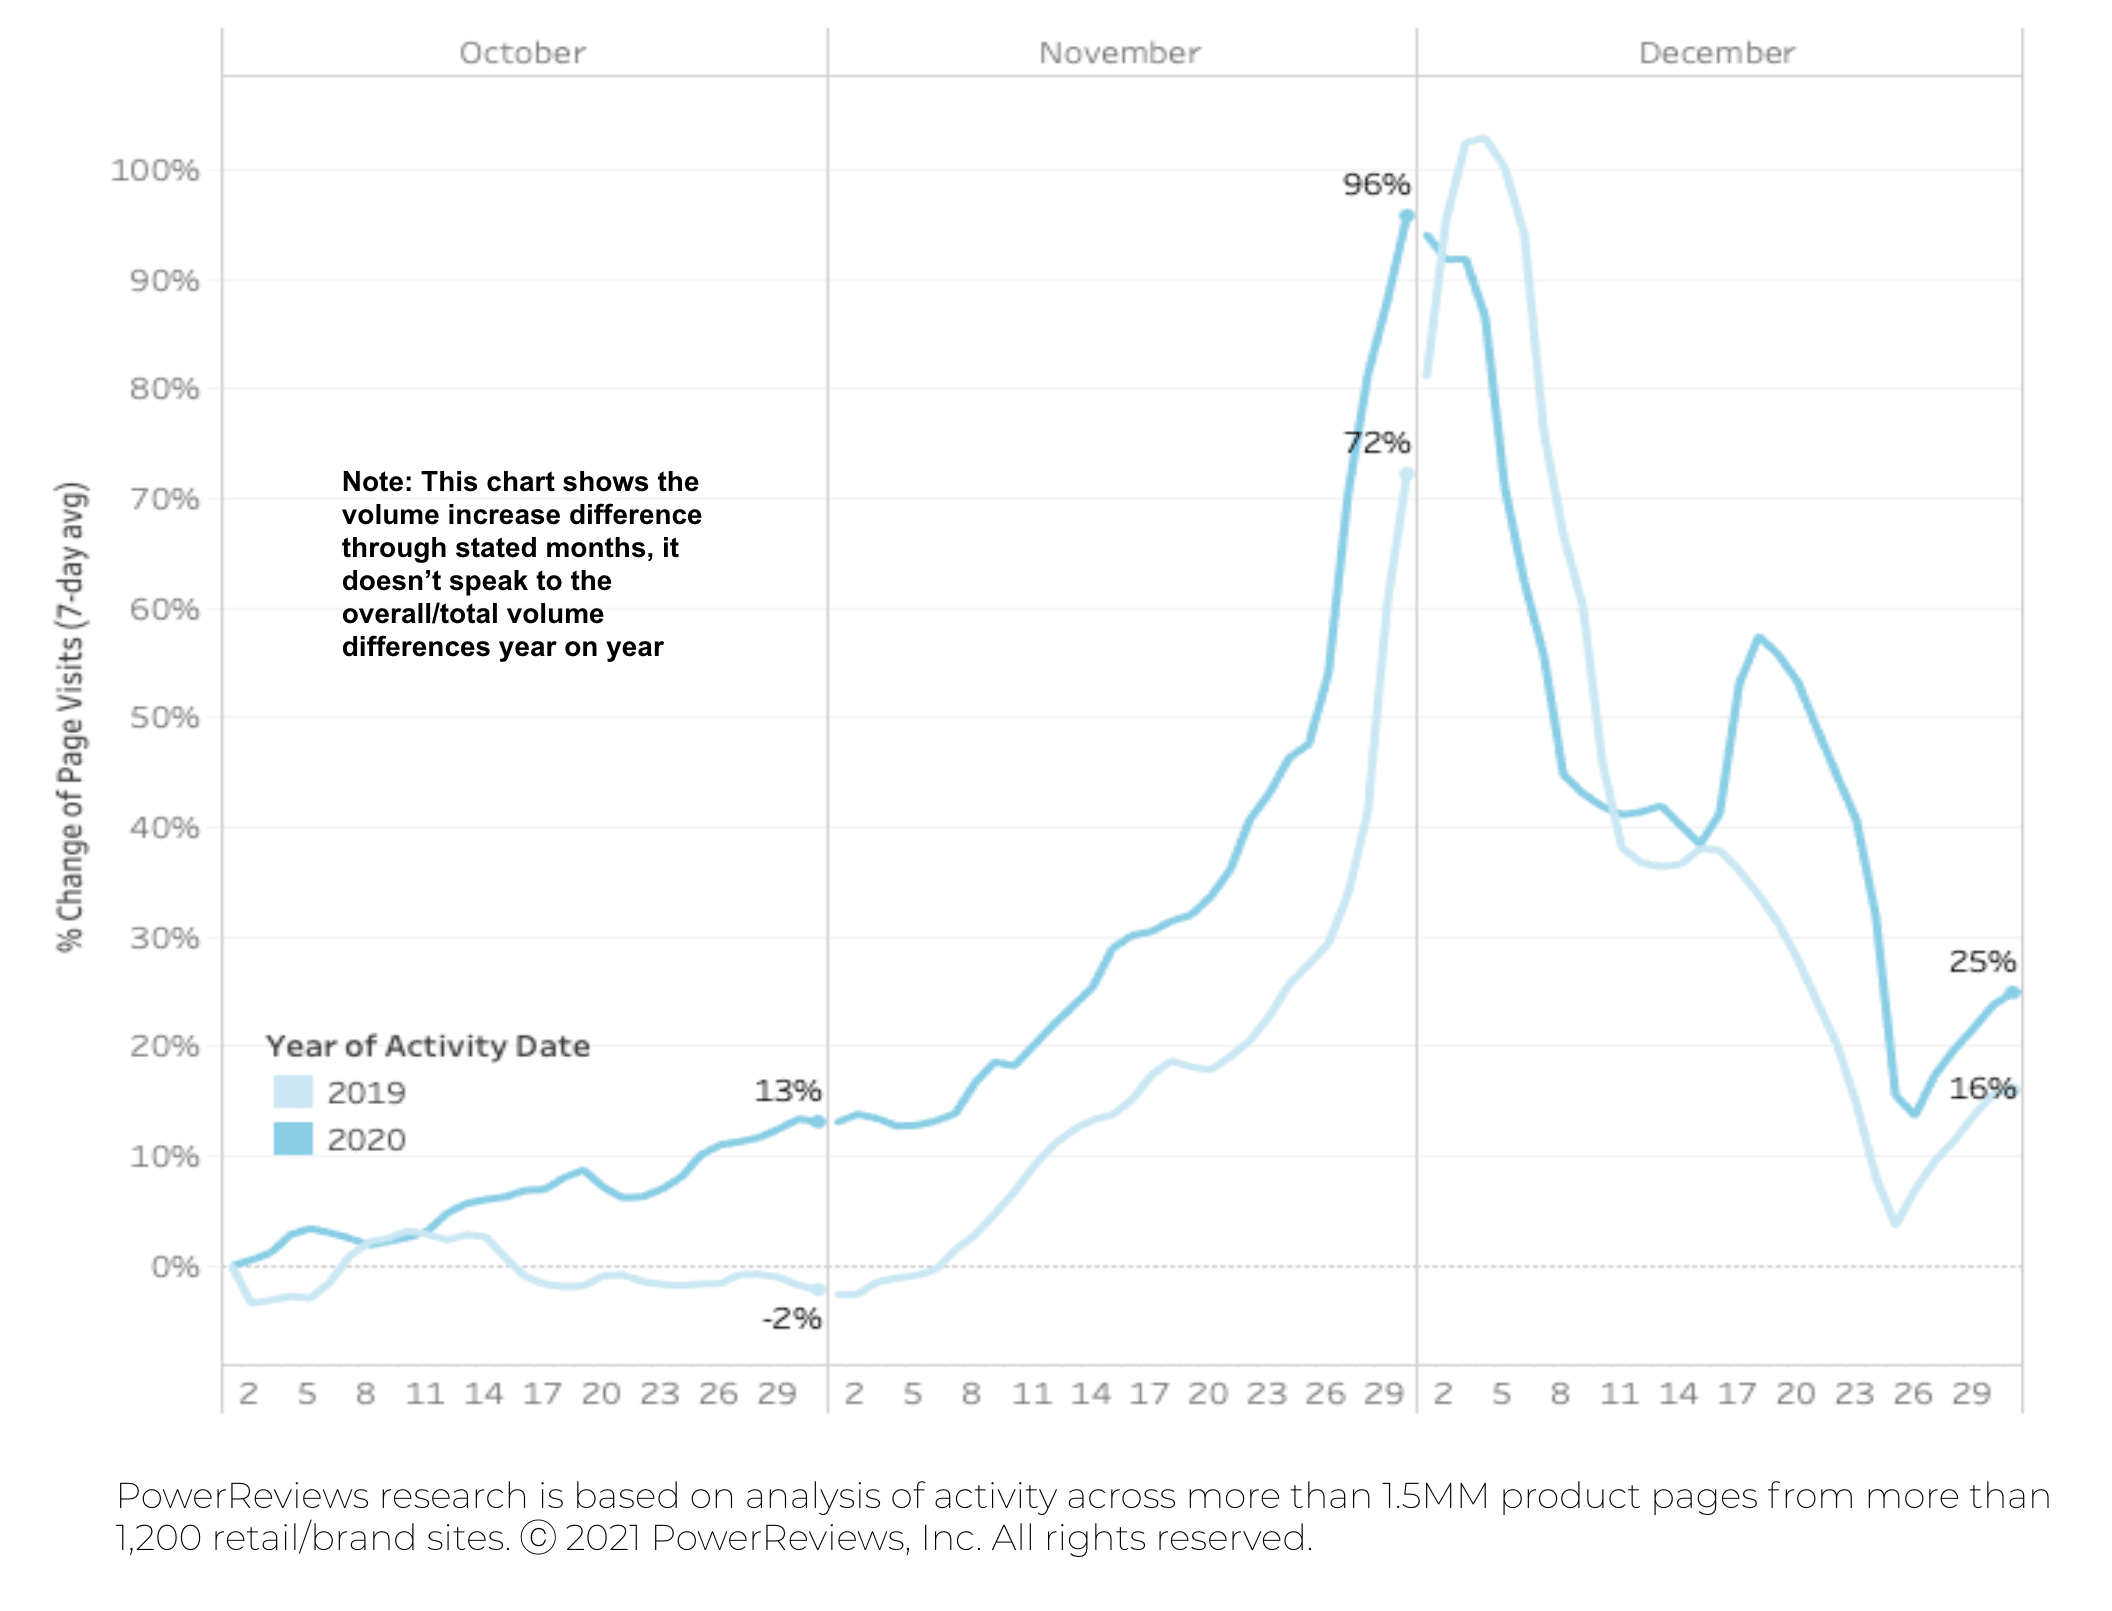
Below we compare the increase in online purchase and traffic volumes for the Cyber 5 weekend over the past two years.
Last month, we commented how surges in purchase volumes were more pronounced in 2020 than 2019. This proved to be a little premature. The relative increase (from pre-Holidays to the Holidays) was actually higher in 2019 than 2020. But – again – this jump is coming off a baseline of between roughly 1.4x and 1.7x higher in 2020. The post-Holiday drop off proved consistent year-on-year.
Relative to the 1st of October, there was a bigger spike in the first week of December in 2019 vs 2020. Purchase volumes were consistently higher year-over-year prior to that date, indicating that shopping was happening earlier and consistently higher during holiday 2020. The spike in last minute December shoppers seen in 2019 wasn’t as pronounced in 2020.
Online purchase volumes actually leap further in 2019 than 2020
Site traffic surge mirrors purchase levels year-on-year
Holidays lead to review submission surge
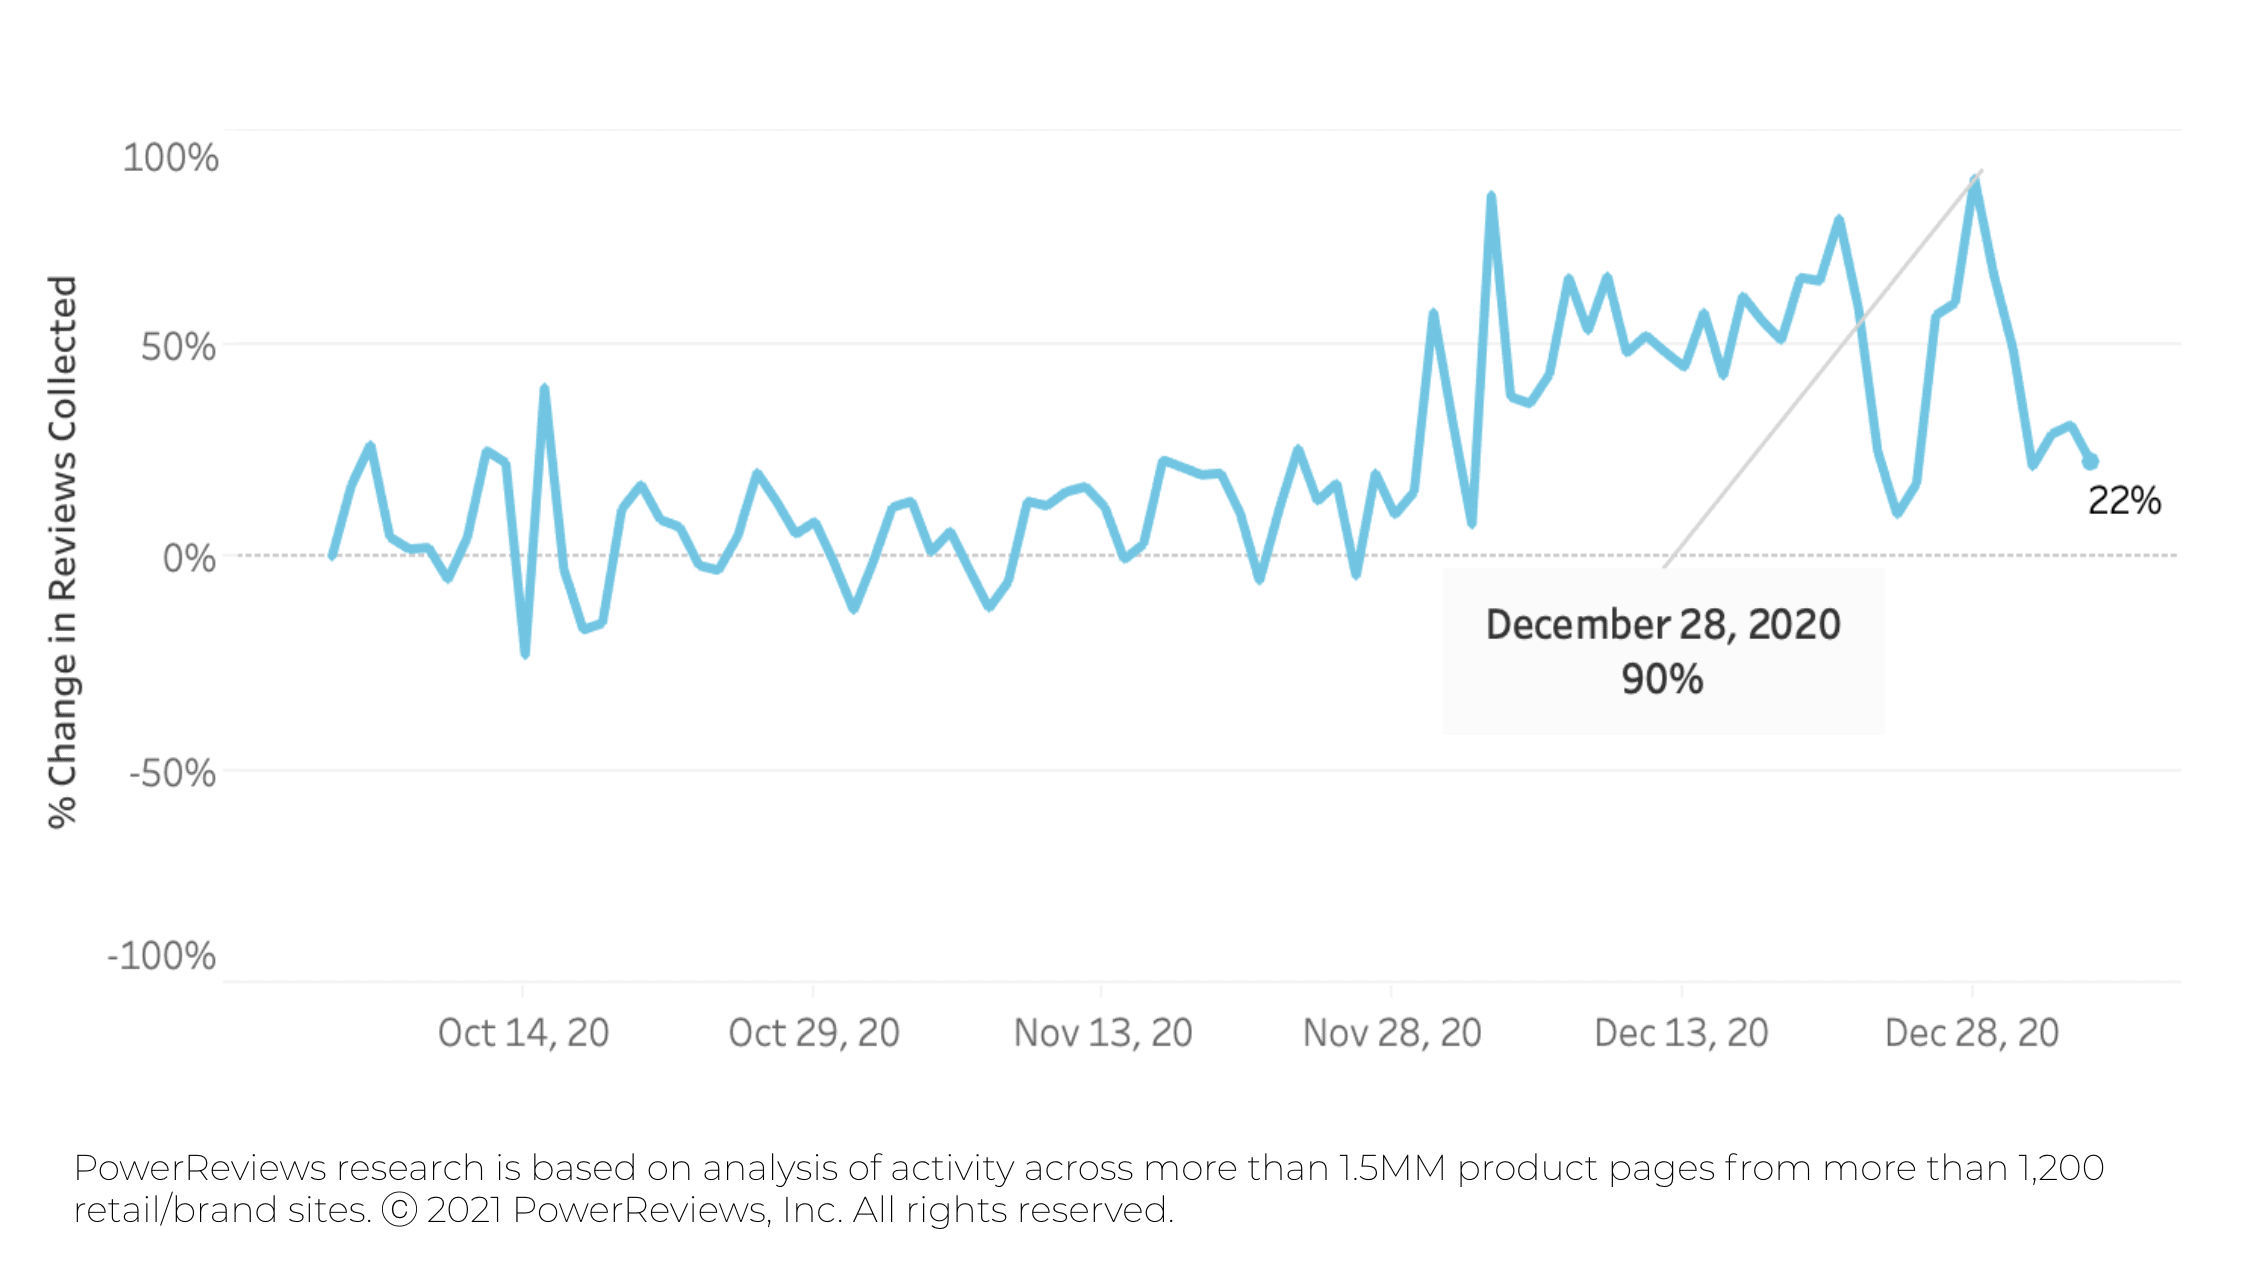
After reporting a significant leap in review submission levels from April to May, we subsequently highlighted a consistent drop through to September to the point where levels were on par with what we saw pre-pandemic.
In last month’s snapshot, we again reported little change but noted that this would be one to watch post Cyber 5 weekend. Our theory being that a leap in overall purchase volumes in this period would be reflected in review submission volumes in the days and week afterwards.
This conclusively proved out, with a giant surge evident at the end of November. This trend – broadly speaking – held throughout the entire month of December – and on December 28 actually peaked at a level 90% higher than where it was at the start of October.
Notably but perhaps unsurprisingly, this was the biggest and most significant increase in review submission volumes we saw all year.
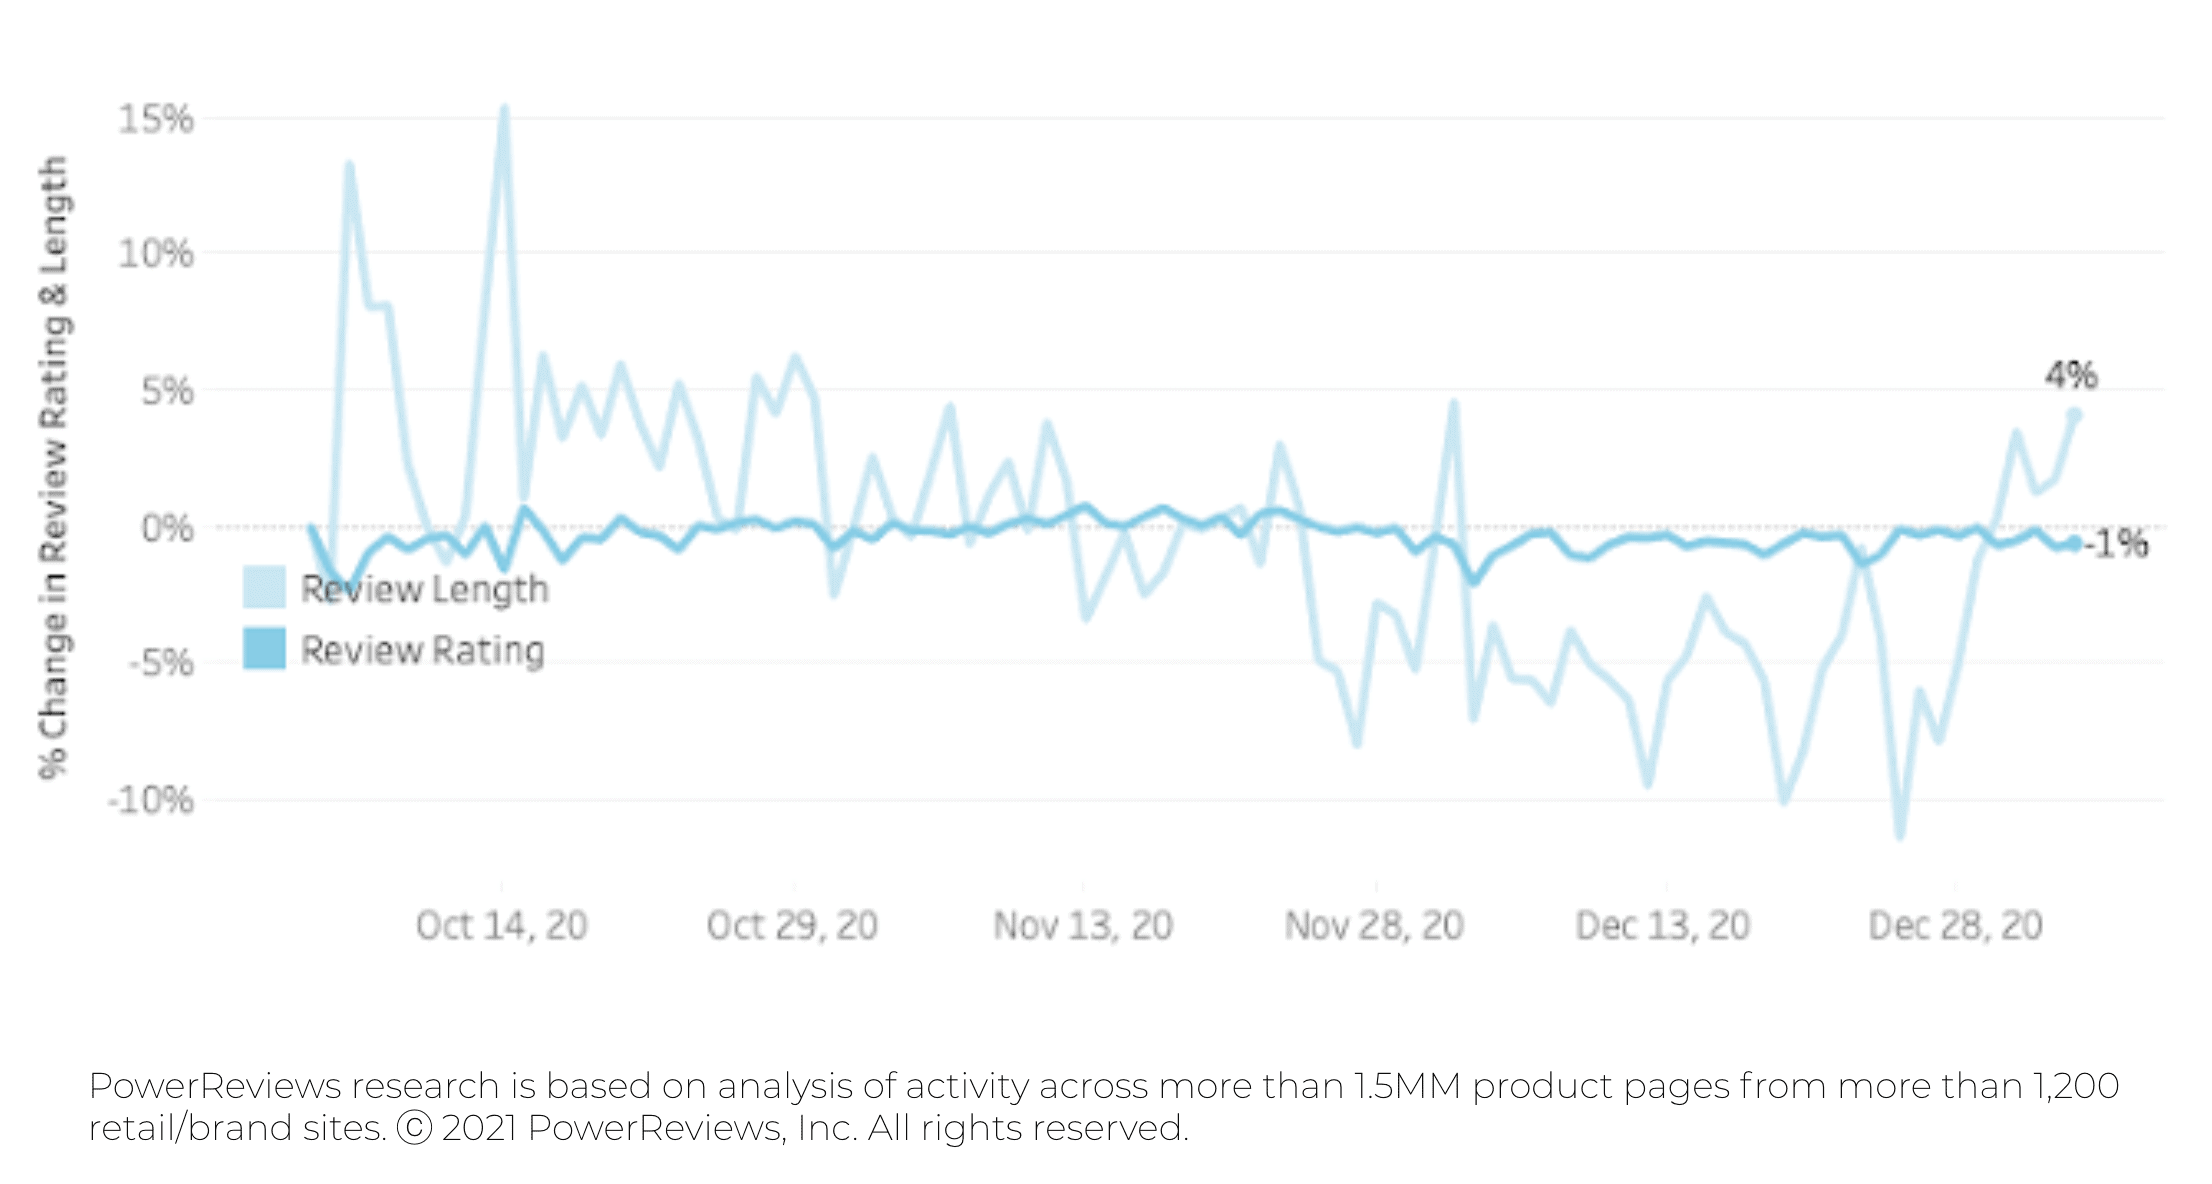
Despite the increase in volumes, trends evident in review length and sentiment were broadly consistent with everything we saw throughout 2020. However, there was a very slight dip in length – peaking at -10% – during this period.
Review submission levels climb in wake of Holiday purchases
Review length and sentiment stable, but slight fall in length evident
Reviews consistently more important than pre-COVID
Last month, we did a deep dive into the impact of review content on the buyer journey – paying particularly close attention to year-on-year comparisons over the Cyber 5 weekend.
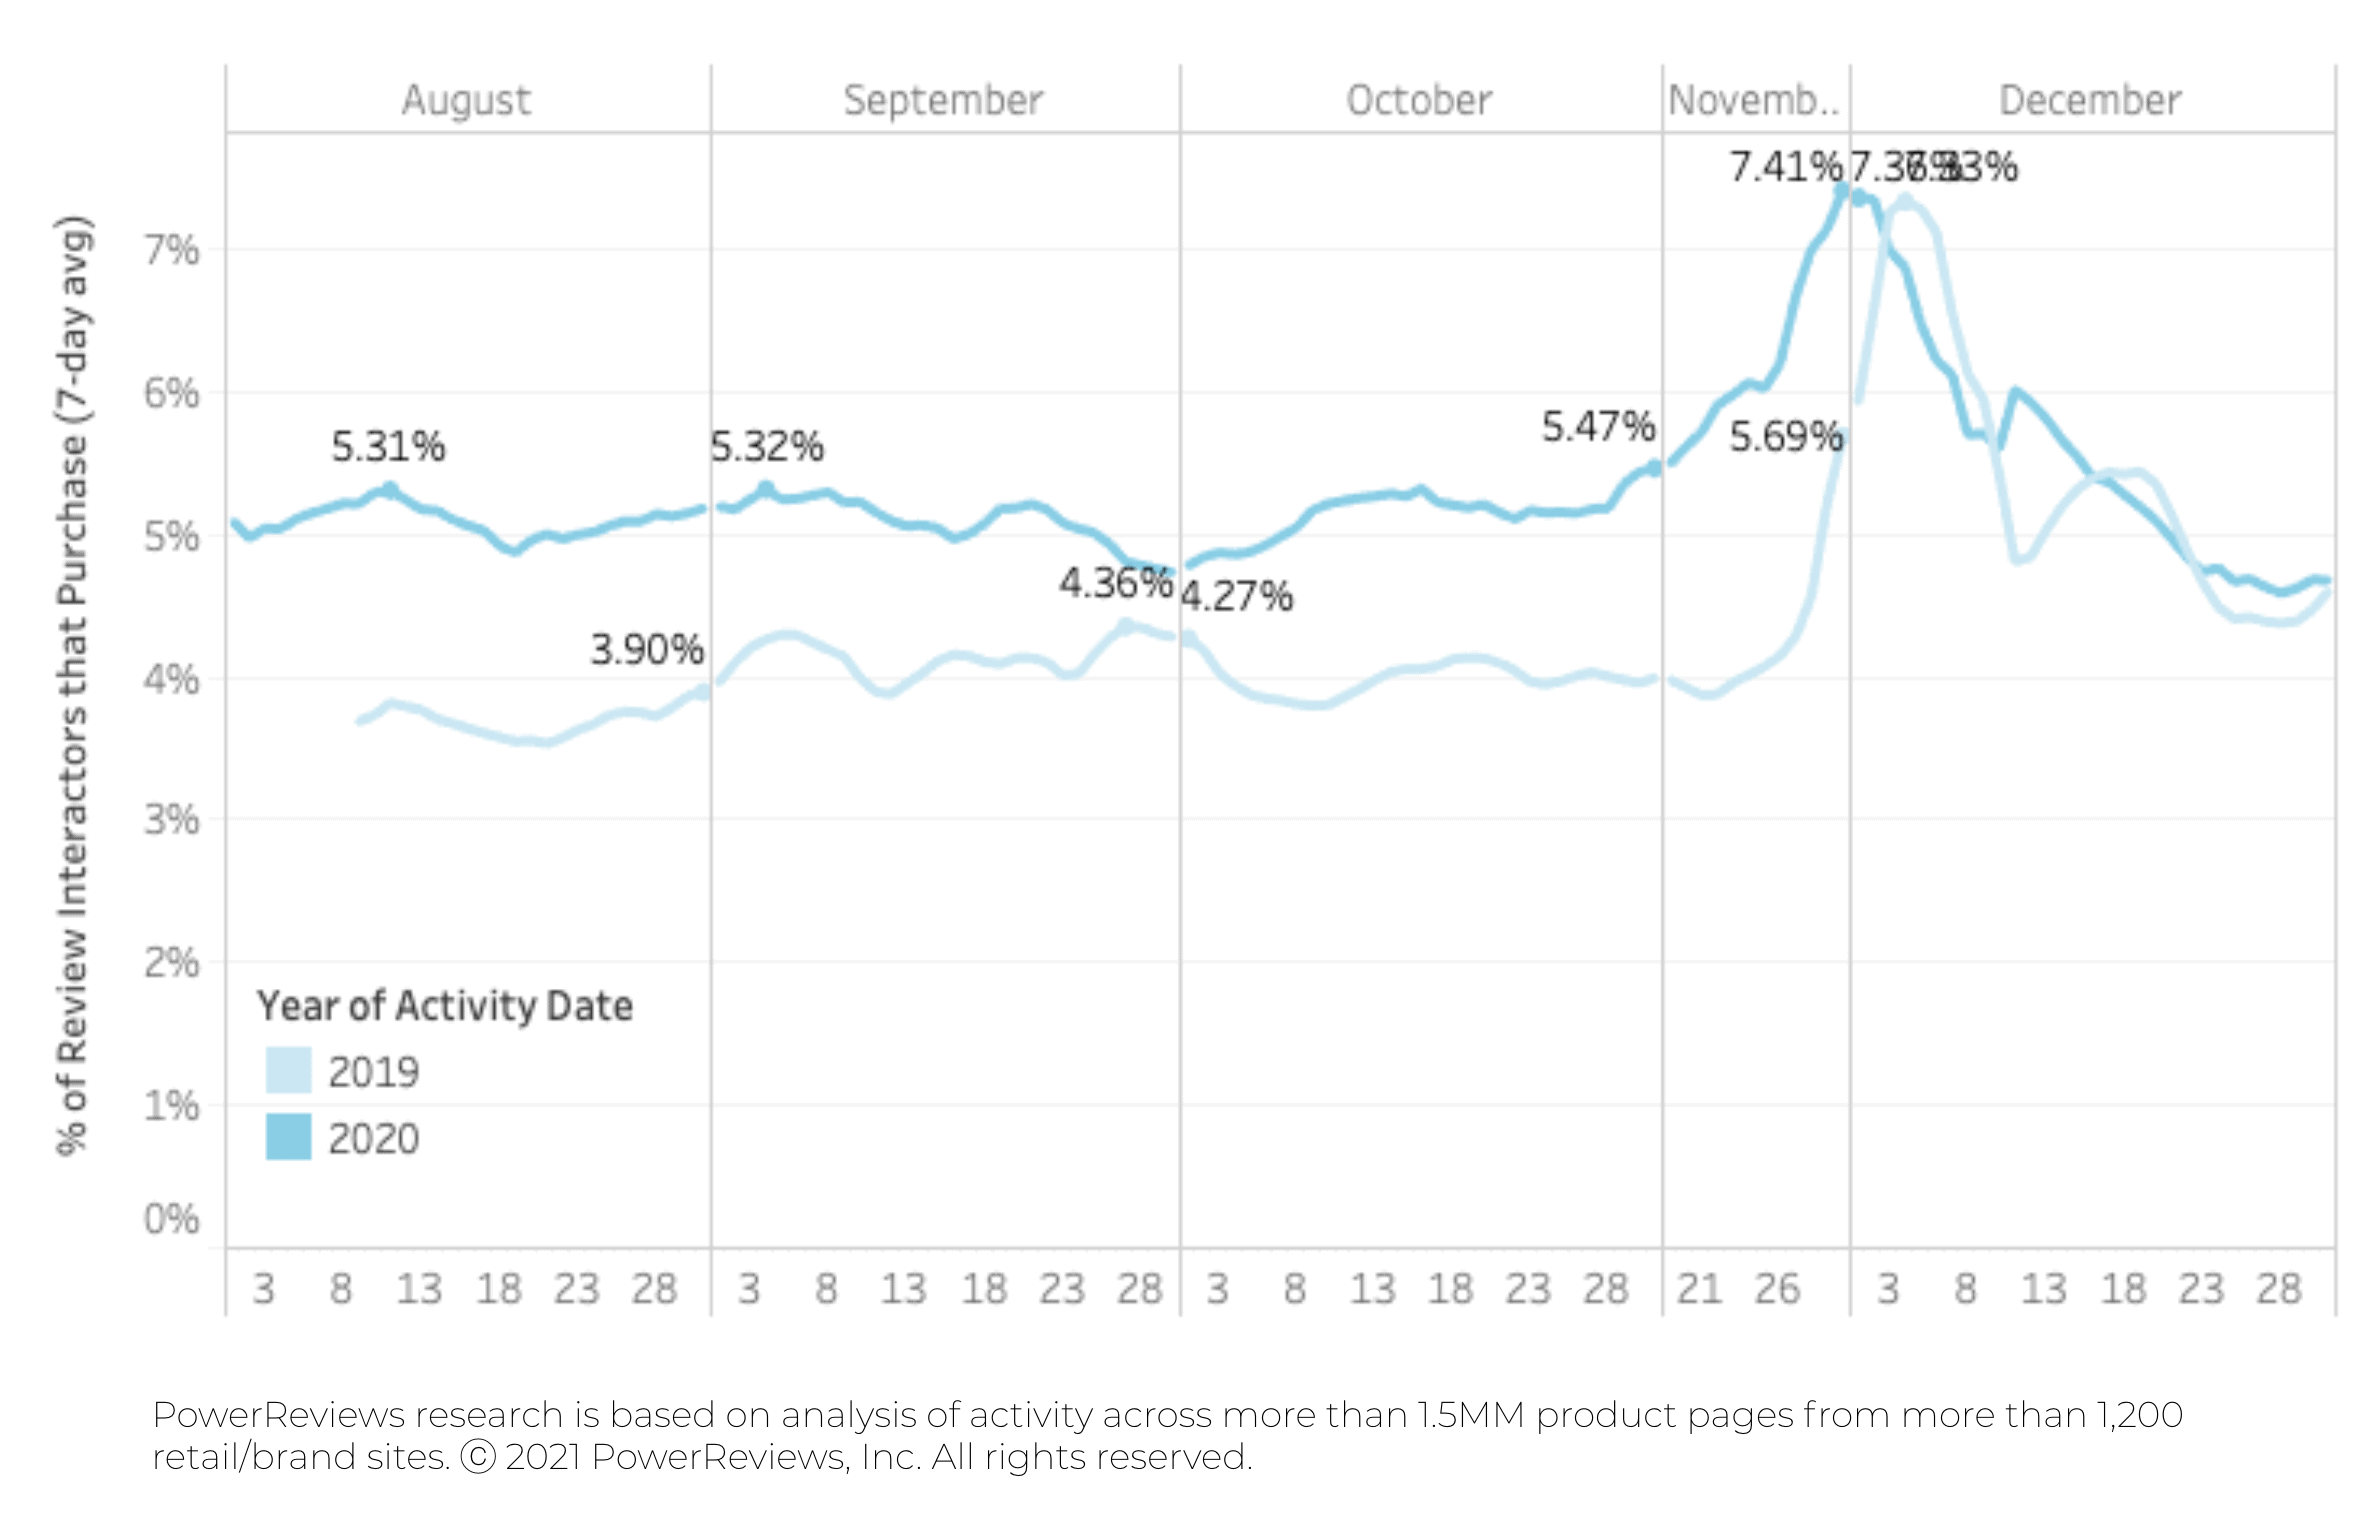
To recap, the charts in this section highlight the percentage of online shoppers who go onto purchase after they’ve interacted with review content (i.e. searched, filtered, clicked to extend the review from preview to view entire content etc.)
We found that review interactors were consistently converting at around a 25% higher rate than they were a year previously (the conversion figure is typically around 5.25% in the three months prior to Black Friday, compared to around 4.25% in the same period for in 2019).
For context, this figure had come down from its COVID peak (as also demonstrated below) of 6.85% in April. This is in line with when we saw the highest ecommerce purchase volumes (when they hit a peak of 210% above where they were pre-COVID at this time).
However, the influence of reviews surged to their highest rate of the year during the Cyber 5, with 7.41% of review interactors going on to purchase (an increase of 30%). As you can see from the charts, this is entirely in line with typical trends. Reviews always become more impactful on the buyer journey during the Holidays.
But – interestingly and despite their generally increased importance during COVID – they topped out at an almost identical level to for the same period in 2019. Given the clear long-term trends evident in the data indicates a clear trend both this and last year, we would expect stabilization at the 5.25% level we’ve consistently seen throughout 2020 as we move out of the Holiday period.
Fast forward to the end of December and review interaction is back at comparable levels year-on-year. Because this runs counter to what we saw throughout the entirety of 2020, we would hesitate to call this a long-term trend. The bottom line is: reviews have become a more influential factor in the buyer journey than before the pandemic.
Review influence almost identical on 2019 and 2020 Cyber 5 weekend
Summary
Having pulled this data at the end of December, these results provided a clear picture of the entire Holiday period.
Ecommerce purchase volumes and traffic have been consistently trending at levels between 1.4x and 1.7x above where they were at the start of the pandemic. What this ultimately meant: a less pronounced Holiday-generated increase in 2020 than 2019. Remember this does not speak to the overall difference in volumes, just how much they changed during the Holidays.
Notably, review submission volumes surged on the back of Holiday purchases. For brands and retailers, this post-Holiday period represents an unrivaled opportunity to generate user-generated content.


