This is the fifth edition of our monthly snapshot (most recent versions here and here), originally established to assess the impact of the coronavirus pandemic on consumer behavior. As always, we draw our analysis from consumer activity across more than 1.5MM online product pages from more than 1,200 retail/brand sites.
This time, we focus on a five-month period (starting February 24 2020 and ending July 26 2020). Each report, we specifically analyze review submission levels, review length and sentiment, overall conversions/sales volumes and review consumption (both absolute and among those who go onto purchase).
After seeing drastic extremes over the course of March through May, we experienced continued stabilization for the second month running. Again, the overriding theme seemed to be that the market had well and truly settled into a “new normal”.
Key ecommerce market trends
01
02
03
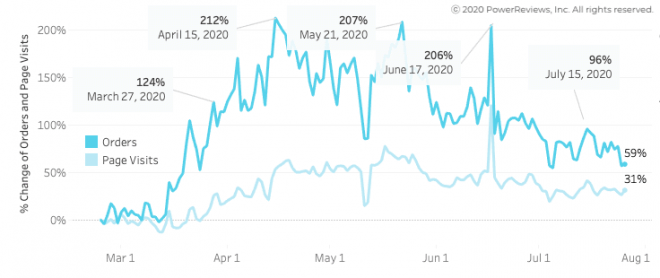
Ecommerce purchase volumes and site traffic consistent over the past month
Over the past four months, we have reported aggressive growth in ecommerce purchase volumes since we started measuring at the back end of February. We consistently saw 3x increases in purchase volumes during April and May. However, this started to tail off in June, a trend that continued in July.
If you analyze the last two months, a very slight but notable decrease is actually evident. It’s too early to tell how significant or long lasting this will prove to be. However, there certainly appears to be clear overall stability with less drastic fluctuations evident. July ecommerce purchase volumes still peaked at almost double where they were at the end of February.
Traffic too has stabilized, remaining consistent over the past two months. As we mentioned last month, customers are now far more comfortable shopping online but have become less decisive over the course of the COVID era – perhaps due to broader economic uncertainty, job insecurity, and associated pressures.
Both traffic and purchase volumes stabilize throughout June and July
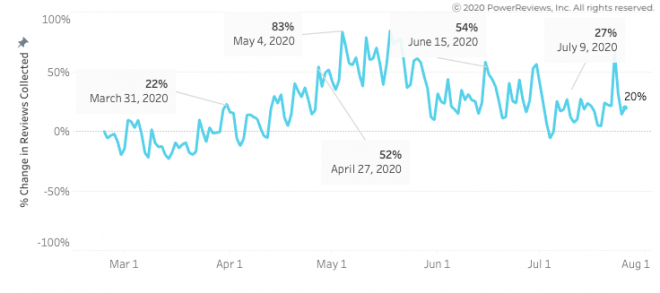
Review submission volumes continue to trail off, but still at higher levels than pre-pandemic
In the June snapshot, we reported a giant 2.3x leap in review submission levels from April to May before highlighting a slight drop last month. These levels were maintained through July 2020.
However, it’s important to note that review submission volumes are still around 20% higher than where they were pre-pandemic. This is despite an initial drop off throughout March, when review submission actually fell right at the time “Stay at Home” orders kicked in. Consumers probably had bigger concerns at that time than writing product reviews.
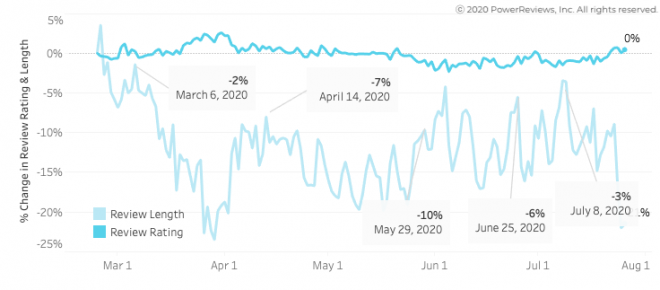
In terms of the actual content of reviews, there were not any huge shifts. Sentiment – in the form of average rating – remains flat, which makes sense given the products themselves are unlikely to have changed significantly in this period. Review length is down slightly on pre-pandemic levels but, given the average review length is 154 characters, a decrease of 10-20% is not particularly significant or meaningful. In our June webinar, we focused on review length in detail and offered some tips how to improve review quality. Check out our blog for a summary of that webinar.
Review submission volumes continue to decline but up on pre-COVID
Review length and ratings stable throughout COVID era
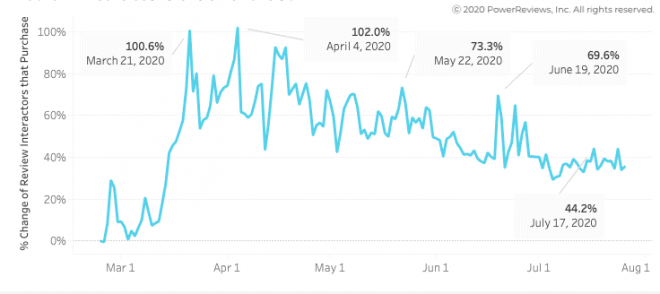
Reviews still converting more shoppers to buyers than before pandemic
As with the other trends we highlight, the impact of review content on consumer behavior remains relatively consistent with what we saw in previous months. In other words, review content continues to be more influential on the path to purchase than it was before the pandemic.
However, while the June and July high in total review interactors were identical (at 66% above the end of February levels), the proportion of review interactors who went onto purchase is actually down (the July peak was 63% below the equivalent figure for June). So consumers are interacting with review content at the same rate as they were last month but are then going onto purchase less than they were then. This is consistent with July’s decrease in orders overall and aligns with the idea that shoppers are becoming more comfortable browsing online, and are less “decisive” in their shopping habits.
But the bottom line remains: Shoppers are still heavily relying on review content to assess product quality and make purchase decisions.
Reviews interaction levels stable from June to July
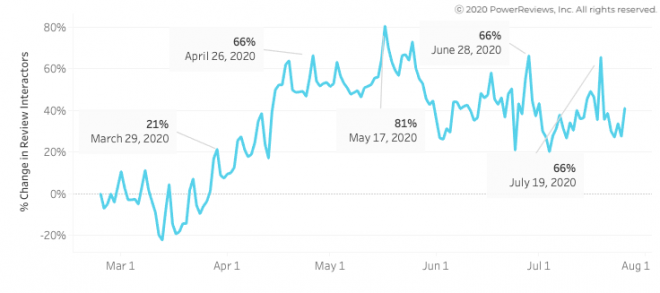
Reviews still convert shoppers to buyers at higher rate than before pandemic
Summary
The story for the August snapshot is stabilization. There are slight declines in many of the metrics we capture but they are not significant. Last month’s assessment that consumers have settled into a “new normal” when it comes to ecommerce seems to have largely borne out.
However, the declines in activity are certainly worth watching. Will they continue into something more significant or will they creep back up to what we saw in May and June?
The crazy numbers we saw at the start of the pandemic appear now to be a drastic reaction to drastic and unprecedented circumstances. It seems to be a safe bet that the more stable trends of May, June, and July will continue into August and beyond given there’s no end to the pandemic in sight.


