At the start of the month, we released our Market Trends Snapshot – an overview of what’s going on in ecommerce right now. As we all know, these are unprecedented times and the data really spoke to that.
We hosted a webinar last week presenting a deeper dive into the findings. During this, we provided in-depth analysis of the overall sales, web traffic and review engagement/submission trends highlighted in the original snapshot data. We also looked at some super interesting health and beauty-specific trends, including sales volumes and review insights in this vertical.
You can check out the recording of the webinar here. Otherwise, read on for an in-depth overview of all we covered plus the answers to questions posed by webinar participants.
Contents
What is the PowerReviews Market Trends Snapshot?
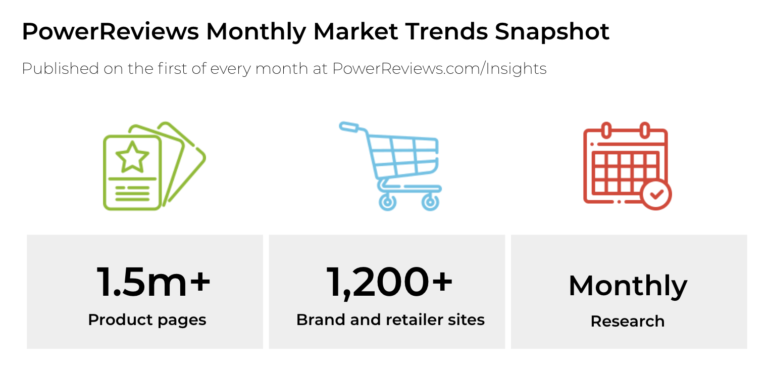
These insights come from analysis of consumer behavior across more than 1.5m product pages on more than 1,200 brand and retailer sites throughout between February 24 and April 24 2020. So they can be considered highly representative of existing market trends. It is published on the first of every month at PowerReviews.com/Insights.
Summary recap
As I mentioned, we originally released this information here. But we explain in more detail in the webinar. Here are some highlights we discussed:
Sales volumes increase 210%
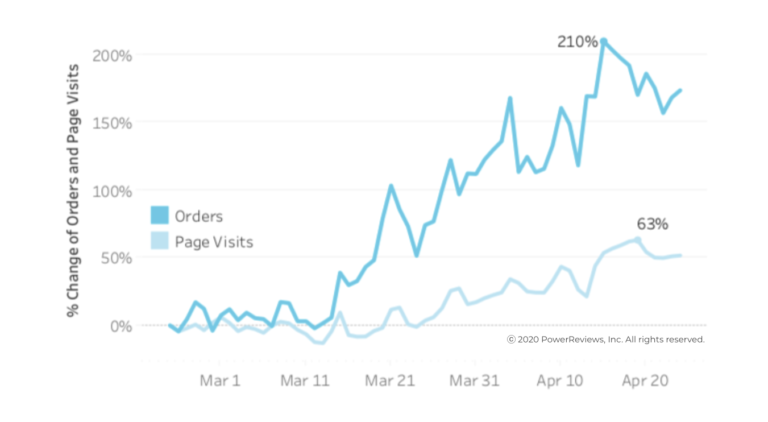
We tracked growth rates from Feb 24 to demonstrate how consumer behavior has shifted during the pandemic. In March, we saw a massive spike in order volumes but page visits remained relatively flat. The massive 101% growth in sales volumes seemingly coincided with the timing of many states implementing “stay at home” orders. Our hypothesis back then was that shoppers were “stocking up” on lower-consideration items. People were buying, not shopping.
But growth has continued at the same rapid rate. Orders peaked at a 210% increase on April 15. By the end of the month, sales were still up 150% on pre-pandemic levels.
We also are now seeing a more meaningful increase in page visits as well. These are up 63% above pre-pandemic levels in late April. This can be attributed to channel shifting, as customers who would never shopped online before are now starting to do so. But given that order increases still outpace traffic increases significantly, shoppers are doing far more buying than browsing.
Volume of reviews submitted starts to rise
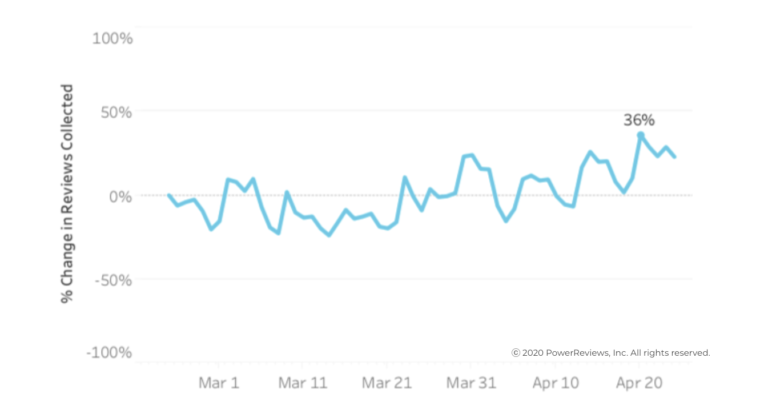
We know purchase levels are increasing. But throughout March, review submissions had actually remained fairly steady. As we moved into April, however, these began to climb too – peaking at up 36% in late April.
This obviously pales in comparison to the rise in order volumes. But it’s super important to note that this is a percentage figure based on a much larger denominator of larger order volumes generally. So, total volumes of customer generated content are at much higher levels than two months ago.
To put it in context, our moderation team is working on review submissions levels close to those they would typically expect in peak Holiday season. This is obviously the busiest time of the year in ecommerce bar none. So quite the statement.
Review length up around 10% since low at end of March
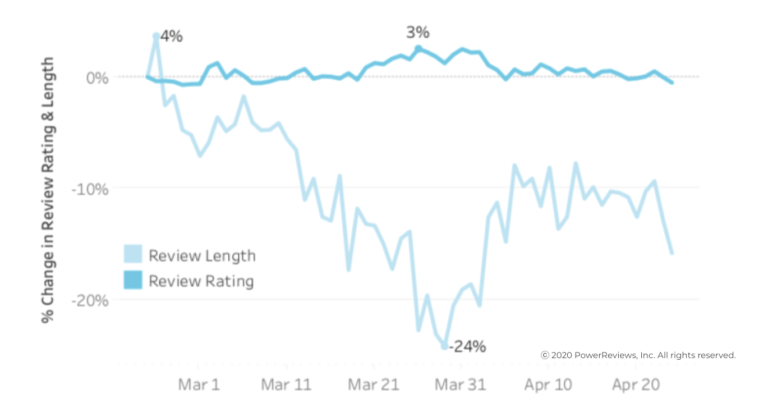
In terms of review submissions, ratings have been stable. This is no real surprise because the products themselves have not changed in the short period we are analyzing.
In our last snapshot, we reported that review length had seemingly cratered after stay at home orders came into effect. In April, this rebounded and increased around 10%. But you should keep this in perspective: the average review length is 154 characters. A decrease of 10-20% therefore isn’t particularly meaningful in terms of impact on consumer behavior.
Regardless of what’s driving this trend, we’re hearing a lot about review length these days from our customers. It’s proven that longer reviews generate more sales. Our product team is actively working on some cool features to encourage customers to write longer reviews. More on that within the next month.
Review content has doubled in importance in driving purchases during pandemic
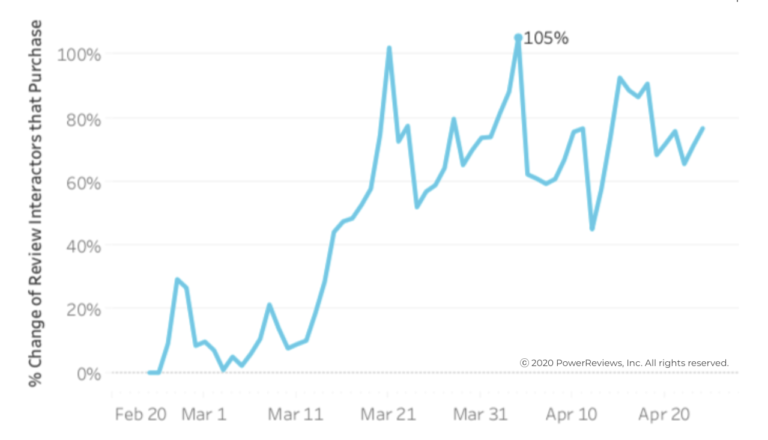
Now let’s look at review engagement among purchasers (we define review engagement as someone clicking on a filter, sorting, clicking a key word etc.). These numbers are staggering as well. Among consumers who purchase, engagement has doubled – peaking at 105% right at the turn of the month.
Keep in mind that this is review engagement as a percentage of purchasers. Purchasers are up 210% the last two months. This is important when considering the dip that occured around April 10. Remember, it was around this time when purchases shot up to that peak of 200%+. So this still represents a hugely meaningful level of interaction with review content.
This really reinforces just how important this review content is when it comes to driving purchasing decisions. Even with shoppers behaving more decisively online than we’ve ever seen before, they are still relying on product reviews to inform their decision making.
Spotlight: Health and Beauty
Why did we focus on health and beauty? Well, we saw some pretty marked trends among these brands when crunching the data. When we dug a little deeper into specific product categories, we found some super interesting storylines – particularly revealing and indicative of different consumer buying patterns in this period.
Pandemic has huge impact on health and beauty consumer shopping levels
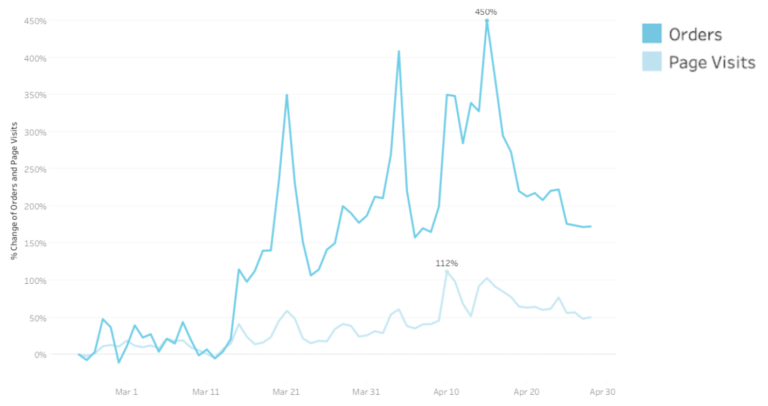
Above, we talk about a vast surge in overall sales volumes of 210%. This is merely amplified in health and beauty, where order volumes peaked up 450% in April. Traffic, too, increased significantly across these brands and doubled compared to February. Again, consumer decisiveness is clearly in evidence with a far higher proportion of visits converting to purchase than we would typically expect.
Extreme and fluctuating demand for specific products
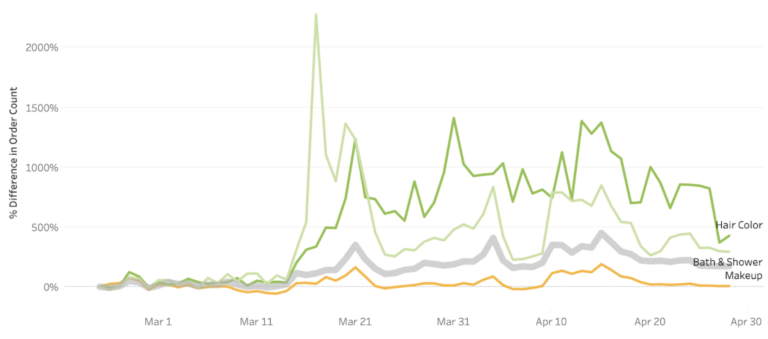
Let’s look a little deeper at different types of health and beauty product groups. Here, we specifically focus on three: Bath and shower (light green), hair color (dark green) and makeup (in gold). The thick gray line highlights the health and beauty vertical average.
Although clearly not the only product categories in this industry, they all tell a very distinct story that’s indicative of broader consumer trends. Buying behaviors clearly vary depending on product, with peaks and troughs at various times. Now we’ll look at each in detail.
Bath & Shower product demand peaks in Mid-March after staggering 2200% increase

The bath and shower product category includes hand soap so this accounts for this insane jump in sales volumes in mid-March (2200%+). This is a clear story of stocking up. Back in early/mid-March, CDC guidance urged the population to wash hands for 20 seconds or more multiple times per day. So, in this context, perhaps this is unsurprising to some extent. But the number is still mind-boggling.
After that, orders level off as the population settles into those “stay at home” orders. A somewhat more consistent increase of around 300-500% in orders. Still very high, but a little more steady.
And similar to every other trend highlighted above, jumps in page visits are not nearly as meaningful as the order volumes. Certainly, there are increases (600% in mid-March) but these are dwarfed by purchase increases.
Although these numbers come down, you should remember you’re looking at a scale going up to 2000% here. However, increases in traffic throughout April can likely be attributed to increased browsing once preferred products sold out or were subject to delivery delays.
Demand for hair color products grew to astonishing levels
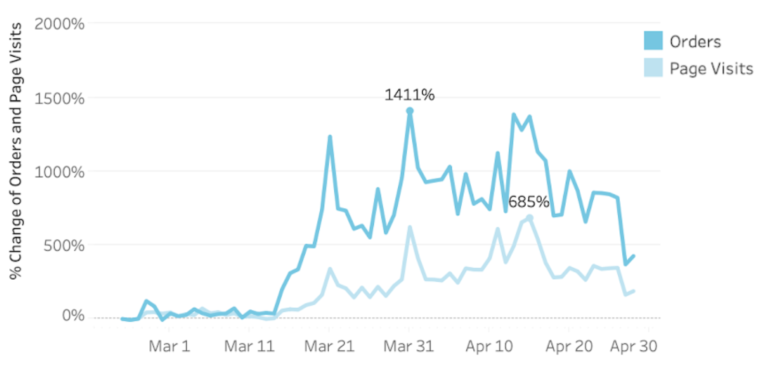
While increases in demand for hair color products never quite reach the same level of intensity as bath and shower, order volumes remained consistently high throughout April. But the jump from early March is what’s interesting. Overall, it’s an increase of way over 1000% (or 11x) over the course of about 20 days.
So, what’s going on here? Here are a few suggestions:
- People thinking they could ride it out for a couple weeks and would get back into the salon sooner than expected
- Strong loyalty to salon colorists and/or hesitancy to try DIY products
- After a couple of weeks, this went out the window and panic set in – hence the surge.
Again, as we’ve seen with pretty much every category so far, the increase in page visits simply does not keep pace with the increase in order volumes.
Makeup spikes later and increase not as pronounced as other health and beauty products

Makeup is the last product category we explore. Interestingly, there is a minor spike caused by some normal stocking up in late March. And then there’s a second wave as presumably people begin to run low. These increases are still significant but just nowhere near as vast as trends we see for other product categories.
Review submission volumes rise significantly in bath and shower and hair color
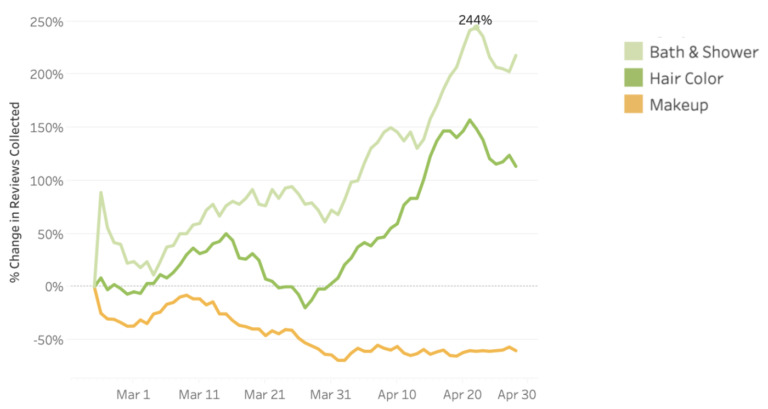
But what about consumer review content? Is this important in the health and beauty vertical?
This chart explores review submission levels across these three same product categories (we don’t ask for reviews until a week or two after the order was placed, which explains the lag).
For the two product categories with those huge surges, review submissions are also trending way up (100-200% in late April for both bath and shower and hair color). For makeup products, review levels actually fell compared to before the pandemic.
Most likely, consumers are focused on assessing products that have the biggest immediate emotional impact. Given how all-consuming the coronavirus has been on everyone’s way of life, it seems that mental toll has affected how they approach providing review content.
Huge review engagement in health and beauty

As explained, the above highlights the percentage of interactions with reviews (i.e. filters, sorting, etc.) for purchasers. We already know health and beauty product order volumes are way up. But the percentage of these purchases that involve a review interaction has also jumped massively.
The peak hits in late March at 313% above the end of February. This is on top of a giant 300% increase in orders during this period. When it comes to health and beauty, review content is simply critical to shoppers’ decision-making. The engagement levels remain super high, well over 100% throughout the rest of April (this was when the industry-wide order volumes shot up 450%).
This makes a lot of sense: the in-store health and beauty product experience tends to be extremely tactile. Shoppers can typically touch, smell or test prior to buying. In lieu of that capability, consumers are relying on the experience of other customers to inform their online purchases.
What does all this mean?
The numbers are pretty clear both across the board, and especially within health and beauty:
- Order volumes are up,
- Review submissions are up
- Review engagement is up
As a ratings and reviews company, we are particularly interested in the fact that customer-generated content has become even more important during the Covid-19 era.
Given this combined with increased order volumes, brands and retailers have an unprecedented opportunity to ensure that their shoppers are more informed than ever.
How? By leaning into existing market trends to generate better quality reviews in higher volumes. While we can’t go into huge detail here (check out this blog post for more), here are three quick cost-effective tips:
- 80% of reviews originate from a review solicitation email. So think really carefully about what goes into that messaging. As a best practice, don’t dilute your request. Instead, use standalone emails that only ask for reviews
- Send at least two emails. Consumers have enough on their minds, don’t expect them to read every email you send them. Check out this blog for some tips on how to ask for more review content.
Consider incentivizing customers either with loyalty points or a sweepstakes entries. Just be sure that if you do incentivize, you badge the reviews accordingly to ensure maximum transparency.
Your Questions Answered: Webinar Q&A
During the webinar, we got asked a handful of questions from our live audience. We answer those here:
Are these all written reviews— or video submissions as well?
Our analysis is based completely on written reviews. That is our speciality. However, we are huge proponents in the power of imagery to tell a story. We know for a fact that review content with customer-generated photographs drives more conversions. We go into detail on how to solicit more customer imagery in our blog on the topic.
Did you see any interesting trends in nutrition (i.e. within the health category)?
In the webinar, we focused on products that we thought highlighted the biggest impact of current market trends. We did not see as big an impact for nutrition products.
Do you have any predictions for future months?
Honestly, no. We have been surprised at the figures. We could’ve predicted the increases, but the extent has been beyond anything we would’ve predicted. We are happy that we will be able to continue to tell you what we’re seeing on a month-by-month basis. Check back at PowerReviews.com/insights on the first of every month for our latest report.
How do you help brands and retailers generate more effective reviews in higher volumes in these times?
Mainly through advising and consulting them. We obviously have a lot of experience in this area so feel we offer valuable perspective and expertise. As we mention, with so much focus on ecommerce, this is a great opportunity to create a bigger and more impactful review footprint.
There are many things that brands and retailers can be doing that don’t cost anything and we talk about some of these above. We also provide some links to further information there too. In addition, we have extensive sampling services.
How do you feel consumer behavior will change post pandemic and what impact will this have on customer-generated content?
All the data indicates that the pandemic has massively accelerated the transition online. We talked a lot in the webinar and above about how some of the data was indicative of consumers who typically shop offline engaging with ecommerce for the first time. The smart money is on at least some of this sticking. The store will never die. It might need to reinvent itself but there are certain things the online experience will just never be able to imitate.
But increasingly, and particularly for specific low consideration product items, consumers are appreciating the convenience and ease of online shopping. Once they’ve got a taste, they might never go back.
In terms of impact on Customer-Generated Content, our data would indicate more shoppers = more review submissions and more interactions with those reviews. So, essentially, we see ratings and reviews content growing in importance. It’s difficult to see how this trend would not play out given everything we see above.

