Ecommerce has been around for decades and the rise in mobile commerce has made selling online much easier, right?
We’ll, not exactly.
There’s still so many challenges to selling online, whether it’s more direct-to-consumer brands or competing with Amazon. Businesses must have a strategic plan to take on the competition, which is why knowing your most valuable ecommerce KPIs and how to measure them is essential to online success.
And in 2019, there’s a plethora of ecommerce tools for brands and retailers to track and measure their efforts. The way ROI is measured across the board evolves with the growth of tools and marketplaces.
For example, Instagram introduced shoppable posts and brands were tasked with not only learning how to leverage yet another powerful ecommerce feature, but how to measure success with new metrics.
The way people shop keeps evolving, so how do businesses make sure marketing efforts are moving the needle?
What Are the Best Ecommerce KPIs to Track?
The best Ecommerce KPIs (key performance indicators) should provide accurate and properly-tracked data to help businesses measure any of its core initiatives. KPIs and their corresponding metrics are an essential part of determining how well a tactic is performing using a combination of data and industry benchmarks.
If you aren’t tracking the right KPIs, it’ll be nearly impossible to get a correct reading on whether or not a campaign is hitting the target mark. However, it’s not enough just to gather this data–it must be used correctly.
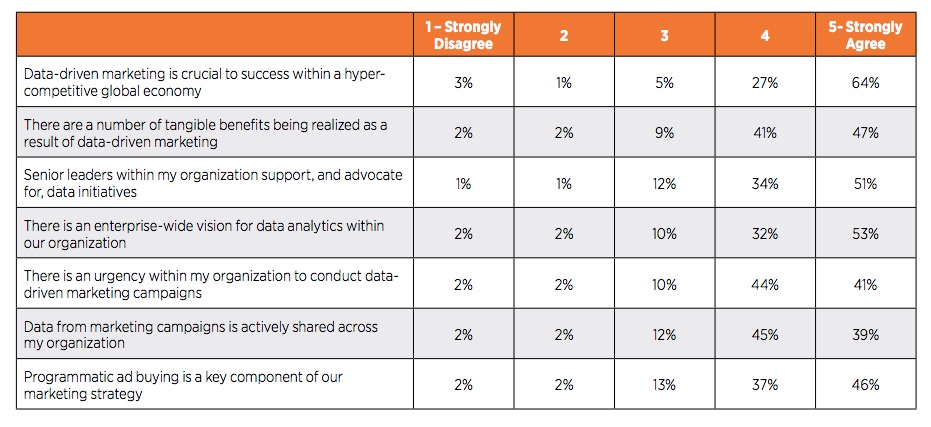
A report from Forbes found that 64% of marketing execs “strongly agree” that data-driven marketing is essential to success. However, a study from Forrester found that between 60-73% of all data within a company goes unused for analytics.
So what’s missing here?
Let’s not beat around the bush–there are a lot of KPIs and metrics you could track, which means understanding what metrics are important to your business is tricky.
But do you need to track them all?
The short answer is no. But the KPIs you should monitor will vary depending on your goals and what you deem essential. Let’s take a look at how to determine the most important ecommerce KPIs:
KPIs That Establish Concrete Marketing Goals
Before you can figure out what to track, you need to determine what you want to accomplish. Unless you know exactly why you need to track a specific KPI for ecommerce, it’s unnecessary work on your end.
Think about your biggest marketing problems like:
- Trouble generating sales
- Customer drop off after first purchases
- Low engagement rates on social media
Whatever you’re trying to improve or change, make sure it’s clear. Otherwise, you’ll have issues not only measuring the success of a tactic, but building a strategy to work toward that goal.
KPIs From Historical Data
The data you already own helps you understand how to plan for future campaigns. Maybe a tactic you thought was going to be wildly successful fell flat or you saw a spike in sales during a specific and unexpected timeframe.
Historical data helps you work on campaign forecasting. And the data from your website, past campaigns and social media channels let you plan future initiatives.
KPIs That Collectively Gauge Growth
We know the KPIs you track should directly correlate with those goals. But the thing is, there isn’t one specific KPI or metric that will tell you the full story. Instead, tracking several metrics paints a broader picture of how the overall tactic is performing.
For example, let’s say you’re trying to increase your sales numbers. What KPIs or metrics should you track? Only looking at your revenue or sales numbers isn’t going to tell you the full story or help you make decisions to improve.
You want to track the KPIs and metrics that give you a well-rounded look at your business as a whole.

17 Metrics to Track the Growth of Your Ecommerce Business
We know the importance of KPIs and associated metrics, but which ones are important for ecommerce businesses?
Let’s take a look at these 17 ecommerce KPIs to gauge the growth of your business so you make informed business decisions and reach your goals:
1. Sales Conversion Rate
Sales conversion rate is the total number of sales you’ve generated over a period of time. To find this, take the total number of sales and divide it by the total number of sessions to your site.
For example, if you’ve made 50 sales and had 100 visitors to your site, your sales conversion rate is 50%.
This metric helps you determine, on average, how much site traffic you need to generate sales. Sales conversion rate is one of the most important metrics to watch as it can help you optimize your site traffic-generating efforts.
2. Response Rate
The Response Rate is how many customers responded to a call-to-action (CTA). It can be calculated by dividing the number of people who responded to the CTA by the total number of recipients.
This metric is important for gauging the effectiveness of a CTA, like if you asked customers to complete a follow-up survey or to sign up for your email newsletter.
Response Rate can also help you determine if there’s any friction between the CTA and your customers. For example, perhaps your survey is too long, and customers click away before completing it, or maybe it’s unclear how to sign up for your email newsletter.
3. Cart Abandonment Rate
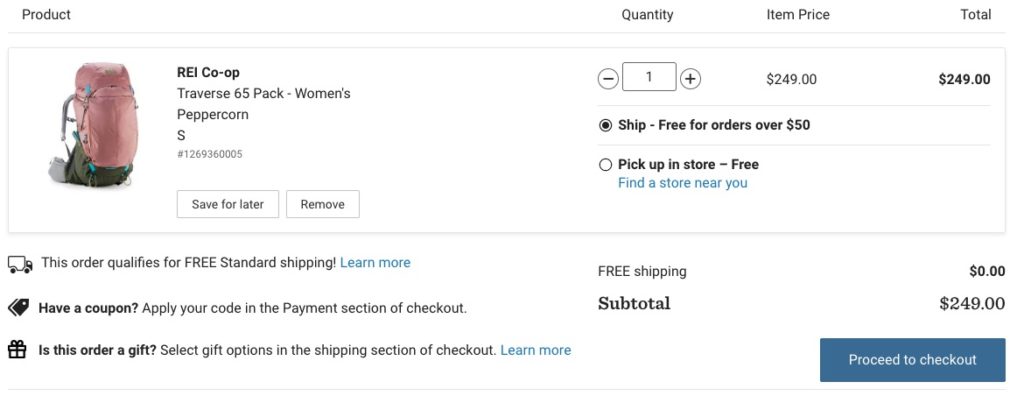
You’ve likely heard of this metric before, and it’s not without good reason. Cart abandonment rate is when shoppers put items in their cart while on your site, but don’t follow through with the purchase. Cart abandonment is an issue for ecommerce businesses across all industries and it could be severely harming your bottom line if you don’t have the right path to purchase.
Find this KPI by dividing the total number of completed purchases by the total number of carts. Then multiply that number by 100. Let’s say there were 400 completed purchases last month and 600 carts created. Divide 400 by 600 and you get .66, which you then multiply .66 by 100 and you get 66% as your cart abandonment rate.
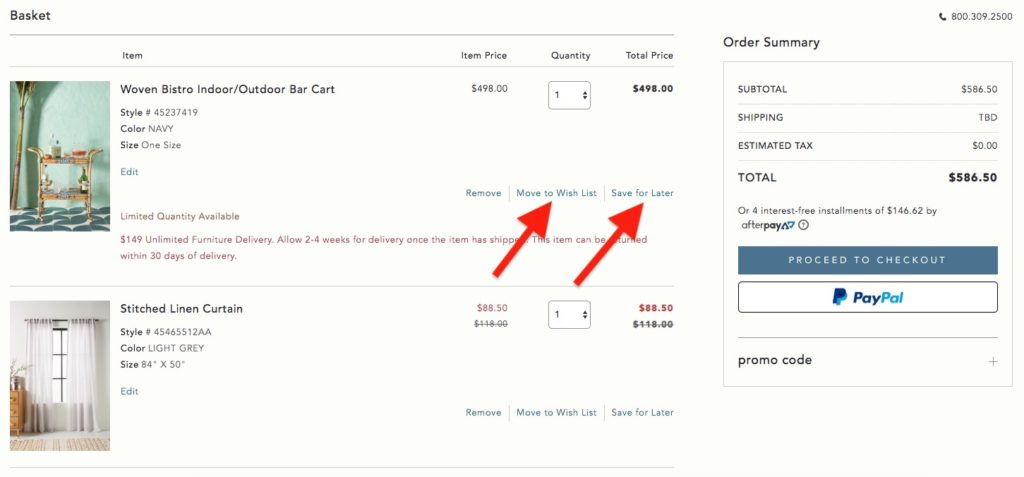
Calculating your cart abandonment rate is the first step in determining if your checkout process is clunky or if there’s another issue (like a lack of trust) among your shoppers.
4. Cost per Acquisition (CPA)
Have you ever wondered how much it costs to acquire each customer, whether it be through social media advertising, Google Adwords or another channel? Cost per Acquisition (CPA) will tell you exactly that. This is critical in determining the effectiveness of your paid efforts and if the ROI tradeoff is worth it.
CPA is calculated by dividing the total campaign cost by the total number of conversions. If your CPA is more than how much your customers are spending, then it’s probably time to review your current strategy. At the same time, this metric helps determine what channels need more investment, money or time.
For example, if you Facebook is a low CPA channel for you—in other words, you don’t lose money acquiring customers through Facebook—it might be worth brainstorming how to scale this channel versus others costing you more money.
5. Average Order Size
With CPA, you know the value of each customer, but what about the actual value of their orders? To calculate this, divide your revenue by the number of transactions, and you’ll see how much each customer contributes to your overall bottom line.
A great way to increase your customer’s average order size is to include an incentive for them to order more at no additional shipping cost. Offering free shipping if the cart exceeds a specific dollar amount or a buy one, get one half off deal are great ways to increase average order size.
6. Average Order Value (AOV)
The Average Order Value (AOV) helps determine the average amount spent by customers each time they place an order. This is calculated by dividing revenue over the number of orders.
For example, let’s say your store generated $10,000 in sales this month and there were a total of 1,000 orders. Divide $10,000 by 1,000 to get $10, bringing your average order value to $10 per order.
This metric comes in handy when determining the pricing of your products and overall ecommerce marketing strategy. It also helps you measure the long-term value of customers as well as their purchase habits.
7. Net Promoter Score (NPS)
Net Promoter Score (NPS) measures how likely customers would recommend your brand to others. Instead of measuring the success of your business with revenue or sales, NPS is great for calculating brand loyalty and customer satisfaction so you better gauge how customers perceive your brand.
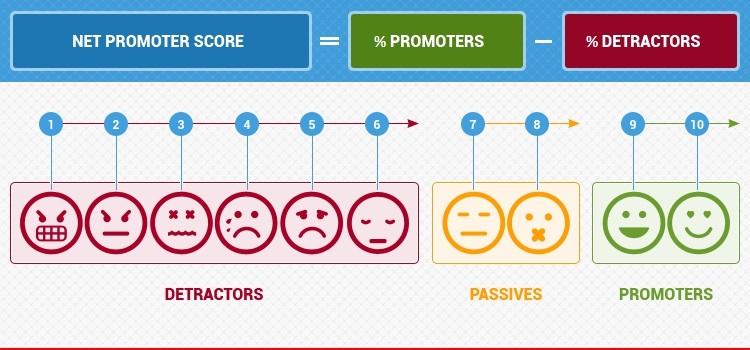
This can be measured with a survey using a simple 1-10 rating scale–zero equaling “Not Likely” and 10 representing “Extremely Likely.” The scale value looks like this:
- Shoppers who give you a 9 or 10 are considered promoters, meaning they love your brand and could be potential brand advocates.
- Shoppers assigning you a 7 or 8 are considered passive or neutral.
- If consumers give you a 6 or below, these people are considered detractors or shoppers who wouldn’t recommend your products or services.
The goal with NPS is to have as high of a score as possible. If your NPS score is low, that could be causing you issues and turning potential customers away.
8. Repeat Purchase Rate
Like NPS, Repeat Purchase Rate also indicates brand loyalty and customer satisfaction. Repeat Purchase Rate is simply the number of times the same shopper has placed an order over their lifetime as a customer.
This can be calculated by dividing the total number of customers who have made more than one purchase by the total number of customers. If you have a high Repeat Purchase Rate, you likely have some very happy customers!
9. Purchase Frequency
Purchase Frequency goes hand-in-hand with Repeat Purchase Rate. In fact, the overall KPI is simply the number of times a customer has made a purchase within a period—usually about a year or so.
This metric is important because it helps evaluate your customer retention strategy and loyalty. It also allows businesses to make better decisions around when to re-engage with customers between purchases and host sales to encourage shorter time in between purchases.
10. Order Gap Analysis
Much in the same aspect of the Purchase Frequency, Order Gap Analysis let’s companies see the time between two purchases from the same customer. This metric identifies trends in shopping behaviors and seasonal or product trends.
Order Gap Analysis also informs other marketing efforts, like when you should send special offers or post-purchase emails to customers.
You can calculate this by dividing 365 (one year) by your purchase frequency number. This would be the average number of days between purchases.
11. Average Customer Lifetime Value
The Average Customer Lifetime Value (CLV) represents the estimated total amount of money a customer will spend during their time as a customer. This metric tallies how much you can realistically spend on acquiring new customers as well as how much you will likely spend trying to recuperate from acquiring that new customer.
This number should always be higher than your customer acquisition cost. Otherwise, you’ll be losing money.
12. Customer Churn Rate
If you find that your Average Customer Lifetime Value is low, it probably means your churn rate is high. Customer Churn Rate is the percentage of customers that never return to your site. In other words, your customers may buy once and never buy again.
There could be many things impacting your churn rate:
- The customer service isn’t great.
- Your product isn’t up to customer standards.
- Navigation is too difficult across your site.
Churn is an ecommerce KPI every company deals with. That’s why it’s essential you know where you stand so you can fix it if needed. Providing more branded content or educational content could give your shoppers the motive to continue buying from your brand.
https://www.instagram.com/p/BzntU9jn97s/
13. Star Rating
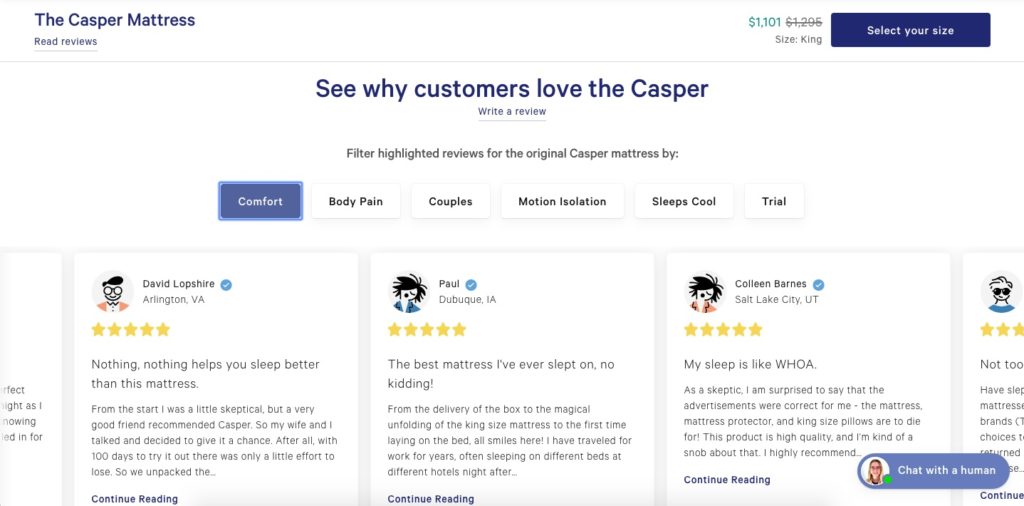
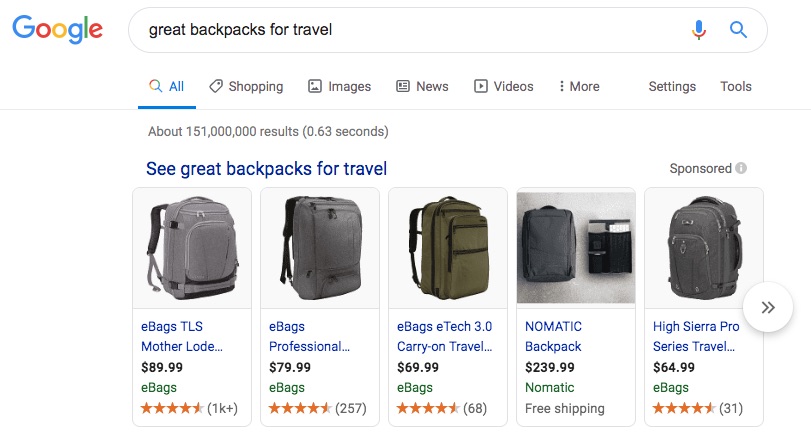
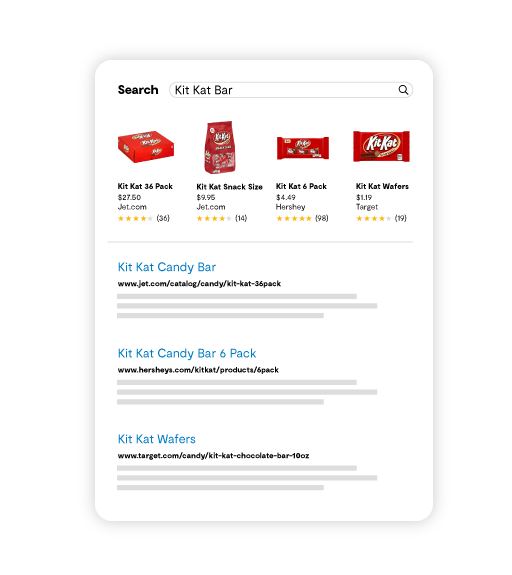
Star ratings help customers determine the value of a product as determined by previous customers who purchased the product in question. If a product has a high star rating from customers, it’s a good indicator of quality.
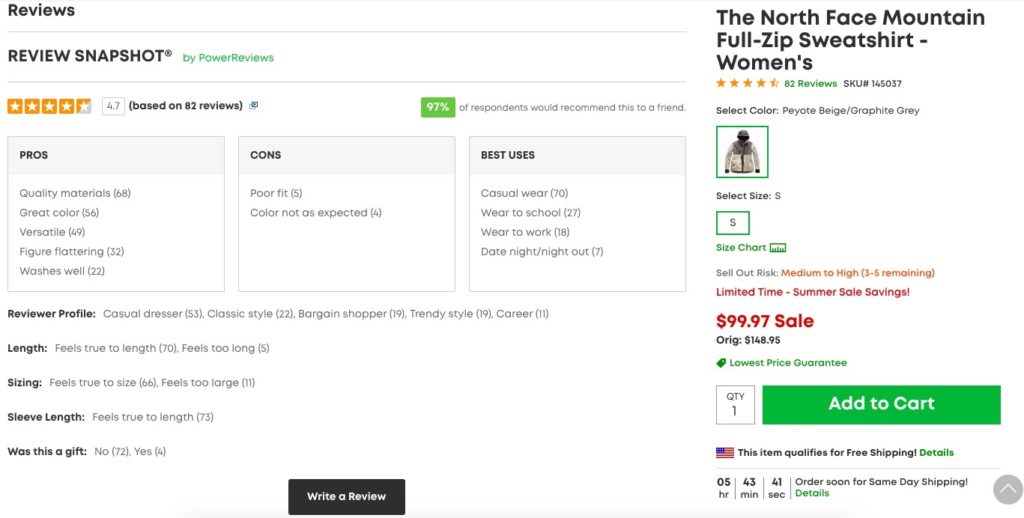
The Reviews to Revenue study from PowerReviews and Northwestern found an average rating between 4.2 and 4.5 stars is most effective—even more than a perfect 5.
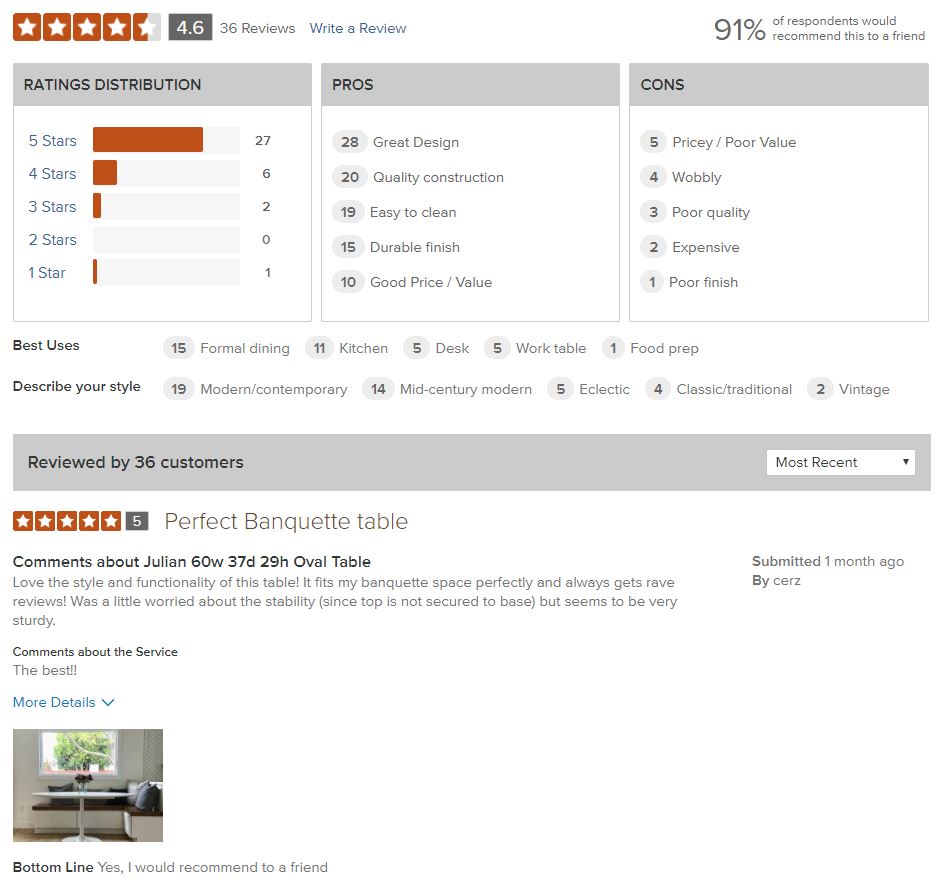
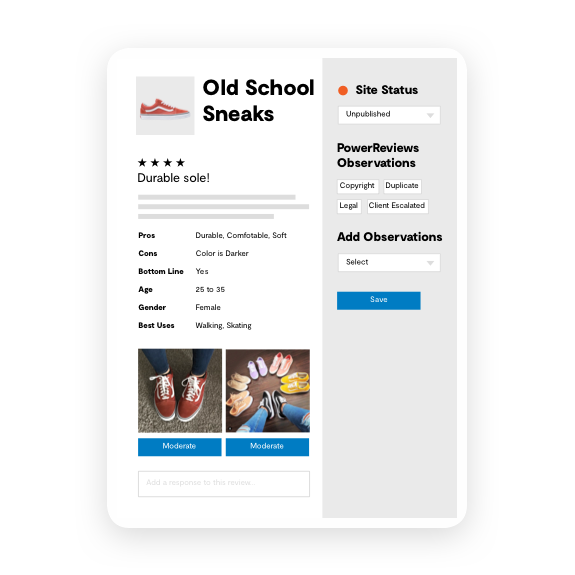
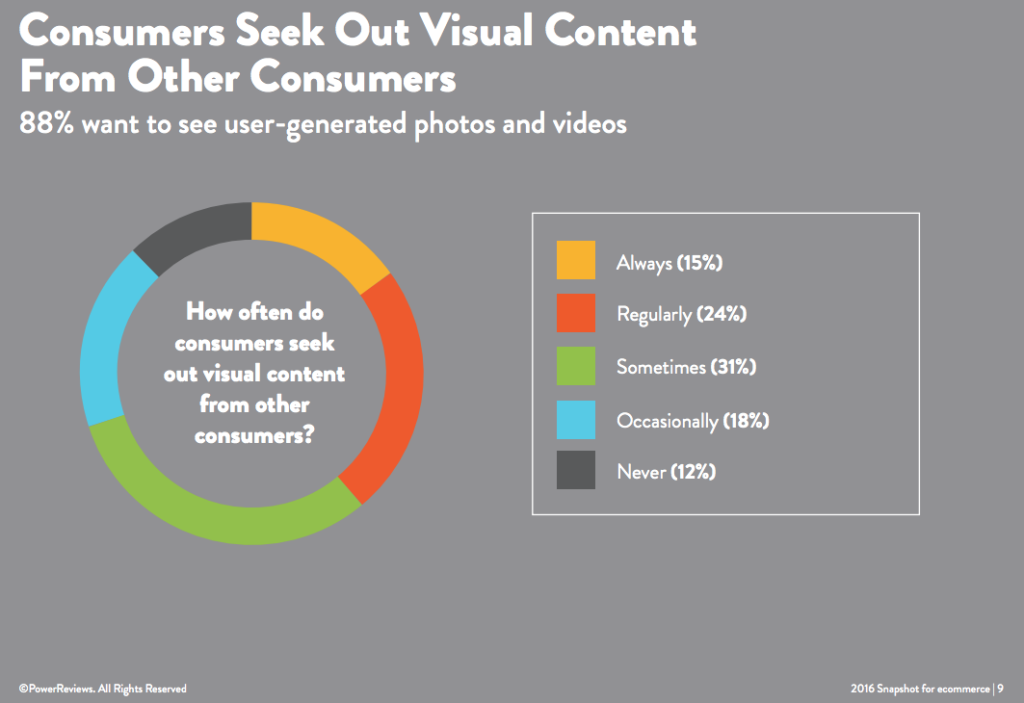
That’s why PowerReviews’ Review Snapshot feature allows brands and retailers to customize their review features to help consumers get a better understanding of the star rating. PowerReviews also optimizes your product pages through visual content elements, which allows customers to see user-generated content of products from other shoppers.
14. Customer Sentiment Analysis
Customer Sentiment Analysis takes a look at the emotions, impressions and attitudes surrounding your brand. Each time your customers write a review about their experience with your company, it’s an opportunity to learn.
That includes experiences on your site or through social media. This metric is essential for a few reasons:
- Businesses make more informed decisions
- Uncovers product insights to make improvements
- It makes your customers happy
- Helps manage your online reputation
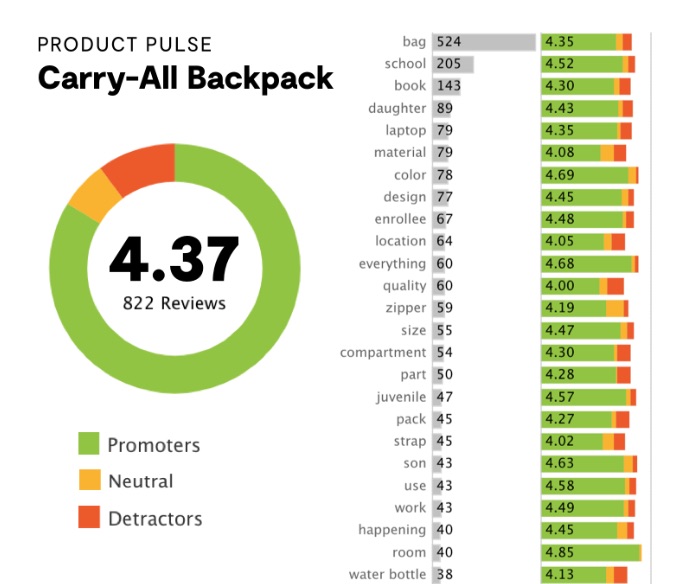
Unlike other KPIs and metrics, understanding audience sentiment calls for a tool that examines review content at the product level. Tools like Product Pulse allow companies to see product insights from review content through customer sentiment analysis. Easily uncover product features that need improvement so your team can make improvements for the future.
15. Organic Traffic Metrics
These metrics are probably familiar for most ecommerce SEO marketers. And while individually they don’t give too much insight into the success or performance of a campaign, collectively these ecommerce KPIs tell a larger story.
- Clicks: This is the total number of clicks from a Search Engine Results Page (SERP) to your site. Because we’re talking about organic traffic, these clicks were generated without the assistance of paid ads.
- Click-Through Rate (CTR): CTR is the total click count divided by the impression count. This metric show the effectiveness of a campaign, such as an email or social media campaign.
- Average Position: This is the average spot the URLs on your site have on the SERPs. This metric helps determine how your site ranks and the quality of your content and website from the SERPs standards.
As a whole, these metrics let ecommerce businesses see the quality of their site and how customers navigate it.
16. Google AdWords Metrics
If you use Google AdWords, there are various ecommerce KPIs to track. However, these are some of the most essential:
- Impressions Share: The number of impressions received divided by the estimated number of impressions you were qualified to receive. Estimated impressions qualification are collected by your ad targeting settings, bids, Quality Scores and status.
- Average Cost-Per-Click (CPC): This metric is the average cost of one click on an ad.
- Ad Conversions: When a customer clicks on your ad and completes the action or goal you set for that ad—like email signups or app downloads.
Together, these metrics help determine how many people saw your ad in relation to how many of those people converted so you better plan future campaigns and optimize current ones.
17. Social Media Engagement Metrics
Like Google AdWords metrics, social media engagement metrics tell a collective story of how your social media campaigns and content is resonating with your customers (and potential customers).
These three metrics can help you gauge how your content is performing overall. Of course, brands want more likes and shares on their posts, but the reality is that on their own, these metrics are vanity metrics—or ones that don’t hold that much weight.
- Likes: This metric may be a like, a favorite, a +1, etc., depending on the platform. To calculate this metric, divide the total number of likes by the number of posts per platform.
- Comments: If people are commenting on your posts, the content is resonating with them in some way or another. Maybe they’ve tagged a friend’s name or replied to your question, but either way, comments indicate that people are engaging with your brand.
- Shares: Similar to likes and comments, shares help determine engagement. Sharing allows your content to go a step further and reach an audience you may not otherwise have access to.
Along with other social media KPIs, these engagement metrics paint a picture of how well your content is doing on a given channel to your target audience.
The Right KPIs Help You Measure ROI to Grow Exponentially
Understanding what the function of each metric is and how it can be used to measure success will help you grow your business and reach your goals.
It can be easy to get caught up in wanting to track everything, but it only makes sense to do so if it’s going to help you reach your objectives. Be smart and strategic when it comes to tracking ecommerce KPIs and metrics, and you’ll see results in no time.
Looking for ways to better track your storefront’s performance? Contact us today, and a member of our team will help make it happen!

